Applying the right amount of nitrogen (N) fertilizer at the right time is challenging because many site-specific factors affect N fertilizer needs. Fertilizers are not the only source of crop-available N. Residual soil nitrate, nitrate in the irrigation water and N mineralized from soil organic matter during the growing season also contribute to the available N pool. Additionally, how much N a crop takes up depends on its seasonal uptake pattern and yield.
Over the last several years the authors, with the help of others, have worked on several studies that provided data on N uptake of different crops, the amount of N mineralized from soil organic matter during the growing season and the factors affecting N mineralization. The results from these studies, which included numerous trials in commercial fields in California, were incorporated into an online tool that allows calculating site-specific N budgets. The objective of the present article is to discuss this online tool and site-specific N budgets at the field scale.
Nitrogen demand
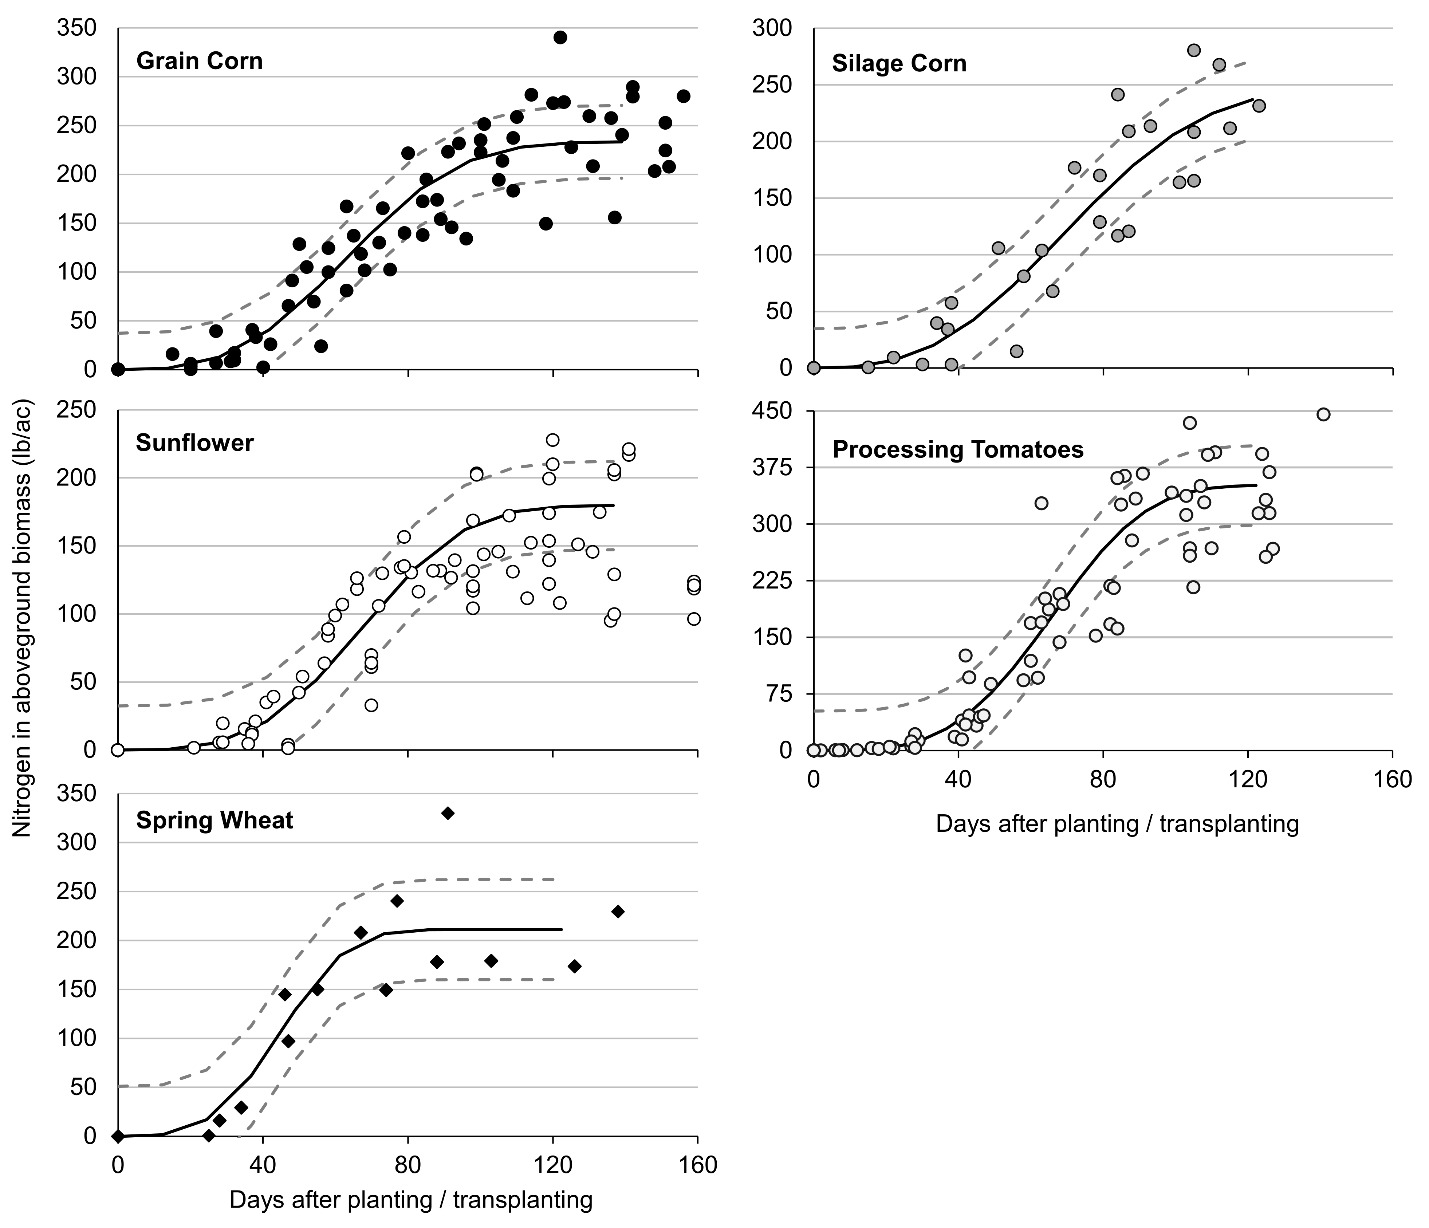
The seasonal N uptake curves shown in figure 1 were developed by collecting the entire above-ground biomass of the crops throughout the season at 3-week intervals in commercial fields and at University of California research and extension centers. Plants were cut at the base, dried in an oven, and analyzed for total N content (Geisseler et al. 2020; Santiago et al. 2025). The points in figure 1 show measured values, while the solid black line is the best fit model. Figure 1 also shows that there is variability across fields. Average values do not capture all the factors that affect crop growth and yield. Therefore, it is crucial to monitor a field during the growing season to ensure that the N fertilizer target predicted by the calculator is adequate. The uptake curves provide valuable information about the optimal timing of N fertilizer applications. Little N is taken up during the first month after seeding or transplanting. A moderate pre-plant of starter fertilizer application can generally supply enough N during the initial 3 to 4 weeks of the growing season. A large pre-plant N application should be avoided, if possible, as some of this N is at risk of being moved to soil layers below the root zone with early season irrigation water or late rain events.
_of_selected_crops_grown_in_california._data_derived_fro.png)
Additional resources
The initial period of slow N uptake is followed by a period of rapid uptake. This is the time when crops take up most of the N. An adequate N supply is crucial during this period. Towards the end of the season N uptake commonly slows down. The S-shaped uptake curve is typical for crops where mature seeds are harvested. As silage corn is harvested at an earlier stage than grain corn, the period of low N uptake before harvest is less pronounced than for grain corn (fig. 1). Some crops, including strawberries, lettuce and melons, do not reduce N uptake before harvest. Examples for these and other crops can be found online (see “Additional Resources” box). Fertilizer N applied late in the season, especially to crops with low N uptake towards the end of the season, may not be taken up by the plants and risk being leached below the root zone with winter rains.
For many crops, the total N uptake is well correlated with yield. Therefore, the expected yield, as entered by the user, can be used to estimate total N uptake. When using expected yield to help generate a crop N budget, the yield entered should be a realistic estimate of what can be produced in an average year and not of the yield that may be produced in an exceptional year. This will help avoid overestimating the amount of fertilizer N needed for the crop to achieve the expected yield.
Nitrogen sources
The N demand of a crop can be met with fertilizer, residual soil nitrate, nitrate in the irrigation water, and N mineralized from organic matter during the growing season. These sources need to be considered when determining the N fertilizer application rate (Geisseler et al. 2020; Santiago et al. 2025).
Residual nitrate-N
Nitrate-N is immediately available to plants, but the amount of residual nitrate and its location in the soil is variable and depends on factors such as previous crop, irrigation management, and amount of winter rainfall, as well as the distribution of rainfall during the winter (Lazicki and Geisseler 2017). As an example, in samples collected from more than 100 fields with annual crop rotations in California over several years, the residual nitrate-N in the top 6 inches of the profile ranged from 1.3 to 95.5 milligrams per kilogram (mg/kg) soil, or 2 to 118 pounds per acre (lb/ac). Half of those values were between 13 and 35 lb/ac. Therefore, a reliable estimate must be based on a recent soil test. Nitrate-N can be quantified by sending samples to a soil testing lab for analysis or measured on-farm using nitrate test strips. For instructions on how to do a nitrate quick test, see links in “Additional Resources”.
Soil nitrate values from lab analyses are commonly reported in mg/kg soil, which is equivalent to parts per million (ppm). These values can then be converted to lb N/ac. For soils in the Central Valley, the conversion factor is commonly between 3.0 and 4.0 for a 1-foot layer. As an example, a lab analysis measures a nitrate-N concentration of 10 ppm in a soil sample taken from the top foot of the profile. Therefore, this soil contains between 30 and 40 lb N/ac as nitrate in the top foot.
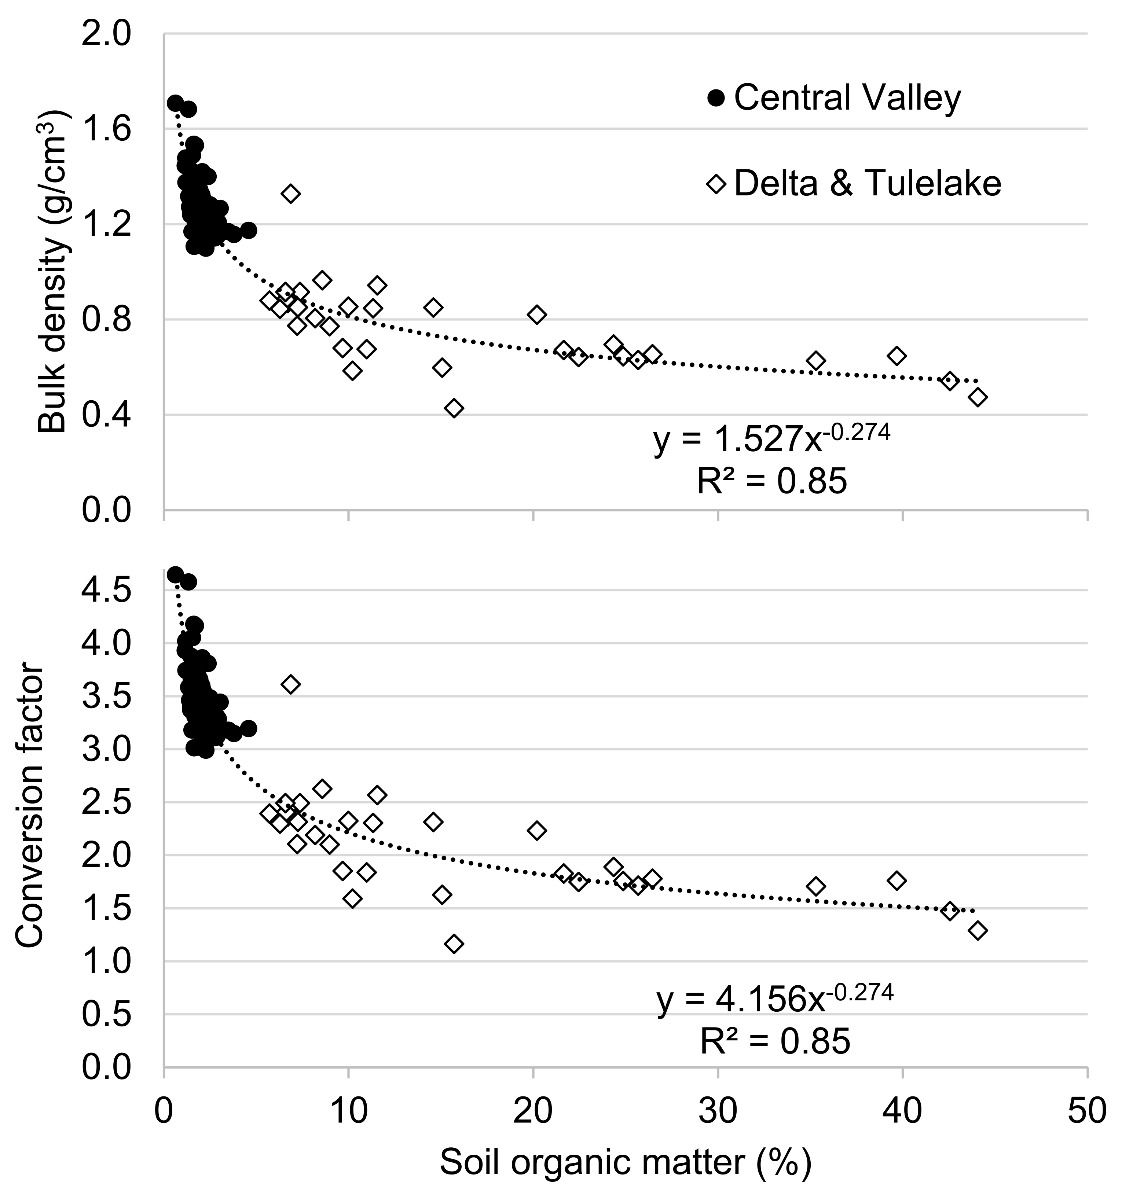
However, the conversion factor depends on bulk density. Our results from more than 100 undisturbed soil cores collected from arable fields indicate that the bulk density in Central Valley soils with a soil organic matter content of less than 5% is generally between 1.1 and 1.7 grams per cubic centimeter (g/cm3) (fig. 2). In these soils, bulk density increases with decreasing clay content (Geisseler et al. 2024) due to a larger pore volume in clay-rich soils. The fact that sandy soils have a higher bulk density than clay-rich soils may be counterintuitive, as sandy soils are often referred to as light soils, while clay-rich soils are considered heavy soils. Soil pores are either filled with water or air. Clay-rich soils can hold more water than sandy soils. Because water is heavier than air, a field-moist sample of a clay-rich soil is commonly heavier than a sandy sample of the same size. However, since bulk density is measured on oven-dry samples, after all the water has been evaporated and the pores are filled with air, a sandy soil ends up being heavier than a clay soil for the same volume.
_and_the_factor_to_co.png)
Bulk density also decreases with increasing soil organic matter content, which is relevant for soil in the Delta and Tulelake basin (Miller et al. 2019). With a lower bulk density, the factor to convert ppm nitrate-N to lb N/ac is also lower (fig. 2). While a factor of 3.0 to 4.0 is generally appropriate for soils with a low soil organic matter content, which is typical for alluvial soils in the Central Valley, it may be as low as 1.5 for soils in the Delta with 40% soil organic matter (fig. 2).
Irrigation water N
While surface water generally has a negligible nitrate concentration, a considerable amount of N may be applied with well water drawn from groundwater aquifers. However, when tailwater is pumped back into a canal with surface water, downstream water may also contain nitrate. To convert nitrate-N concentration in the water to lb N/ac, ppm nitrate-N in the water is multiplied by 0.226 and by the number of acre-inches (ac-in) of water applied. For example, with 24 ac-in of water containing 10 ppm nitrate-N, 54.2 lb N/ac are applied.
Nitrogen mineralization from soil organic matter
Nitrogen mineralization is the release of ammonium into soil solution when soil microbes decompose organic material. Ammonium is a mineral form of N that is plant available. In aerated soils, it is usually quickly converted to nitrate. Based on our field trials in the Central Valley, 25 to 60 lb N/ac are commonly mineralized from soil organic matter during the growing season (Santiago et al. 2025). This estimate is higher for Delta soils and soils under organic management. The exact value depends on the length of the season, soil temperature (Miller and Geisseler 2018), and soil moisture, as well as soil organic matter content and to a lesser degree soil texture (Santiago et al. 2025). Higher organic matter contents lead to higher N mineralization rates. Sandy soils generally have lower soil organic matter contents than clay-rich soils; however, when comparing two soils with the same soil organic matter content, less N is mineralized in clay-rich soils. This is due to physical and chemical protection of organic molecules by clay minerals (Geisseler et al. 2024). Organic molecules can adsorb strongly to clay particles, or they may interact with polyvalent cations, such as calcium, located at mineral surfaces. Both processes can reduce the bioavailability of organic matter and lower decomposition and N mineralization rates. Organic molecules can also be protected physically within aggregates. Aggregate formation and stabilization are promoted by clay minerals. Occlusion in aggregates restricts access by decomposers and thus reduces N mineralization.
Fertilizer
The difference between crop N uptake and the N available from the non-fertilizer sources discussed above needs to be met by fertilizer. Not every pound of N applied with fertilizer will be available to crops. Nitrate, for example, is very mobile in the soil and moves with the water from rainfall and irrigation. Therefore, an important factor determining N use efficiency is irrigation management. Overirrigation can result in water movement below the root zone.
The risk of moving nitrate below the root zone is generally highest with pre-plant and early season irrigations because these irrigations tend to have a higher volume of applied water and there are few to no plant roots to take up the nitrate. During these periods, evapotranspiration (ET) — the combined losses of water from soil due to evaporation and transpiration by plants — is small. Early season irrigation, especially with sprinkler and furrow irrigation, often exceeds crop demand, as the focus is to provide good conditions near the soil surface for seed germination and plant establishment where rapid drying can occur. A high N use efficiency can only be achieved with efficient irrigation management. If excess leaching takes place, an N budget will underestimate fertilizer N requirement to meet crop demand, and more N than expected will have moved below the root zone by the end of the season.
An online nitrogen budget calculator
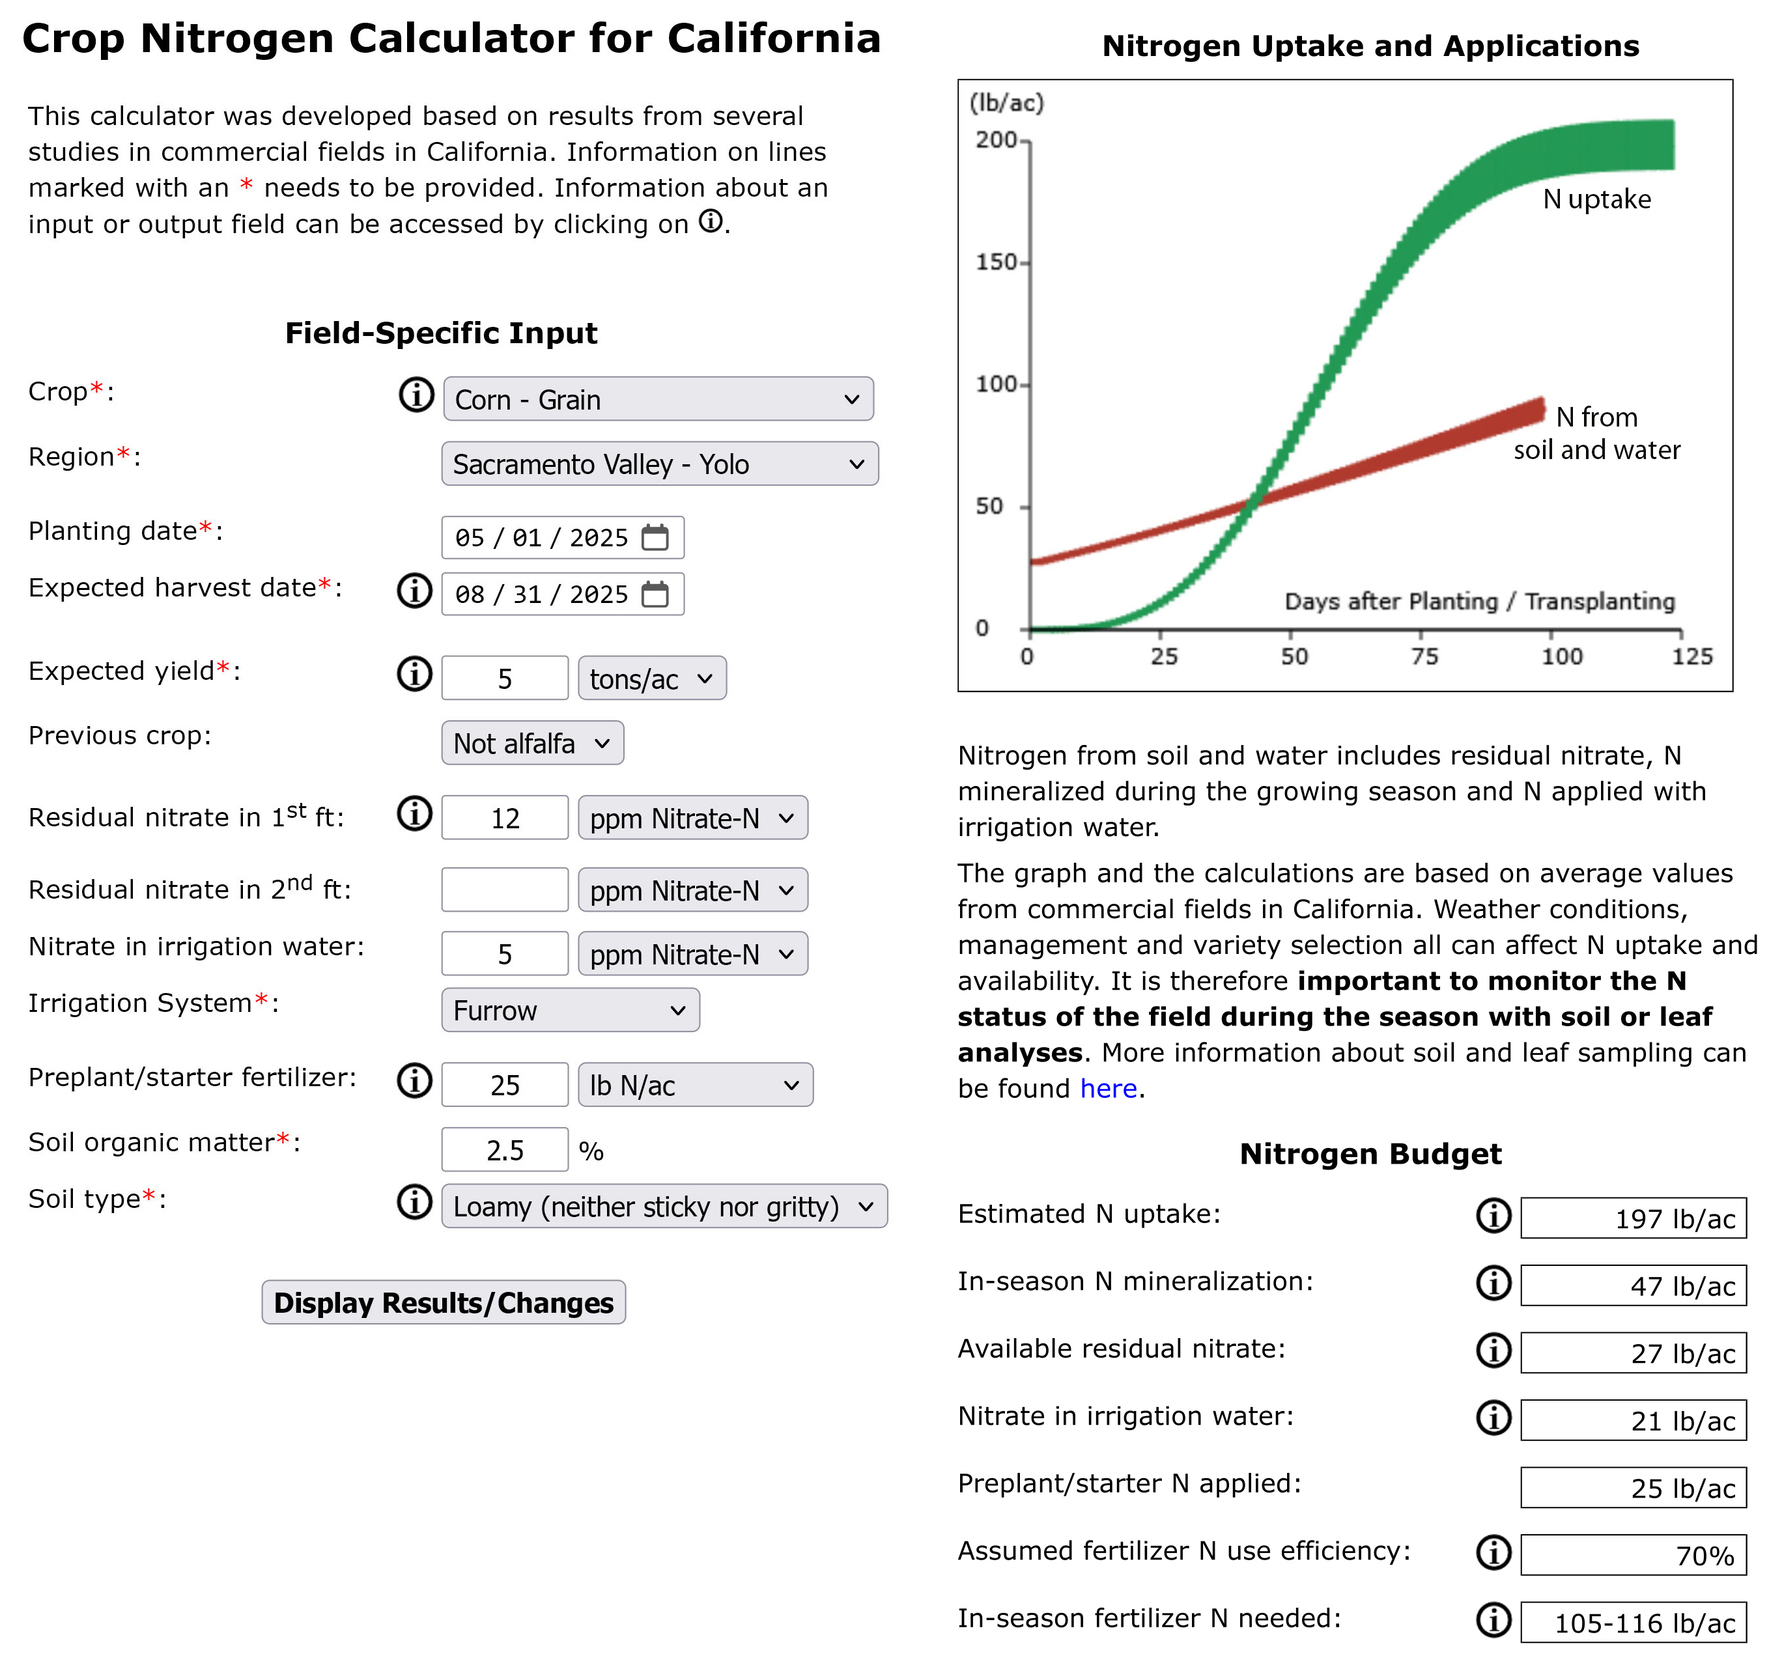
The information provided so far does not suggest that site-specific N budgeting is an easy task. For this reason, we have developed an online tool that allows determining total N uptake by the crop and available N from non-fertilizer sources to calculate how much N fertilizer needs to be applied (fig. 3). The calculator is available online at http://geisseler.ucdavis.edu/Crop_N_Calculator.html and has been calibrated so far for grain corn, silage corn produced under non-dairy conditions, sunflower, spring-planted wheat, and processing tomatoes. More crops will be added in the future. The tool is site-specific and requires readily available user input.
_and_output_(right)_screen_of_the__n_fertilizer_calculator_(ht.jpg)
The tool calculates total N in the shoot biomass based on the expected yield. For example, grain corn with an expected yield of 5 tons per acre accumulates on average 197 lb N/ac in the shoots, which includes the stems, leaves and ears (fig. 3). A graph shows the seasonal N uptake curve based on crop-specific parameters and the planting and harvest dates entered by the user.
Residual nitrate in the root zone is calculated using measured soil nitrate values, which can be entered as “ppm nitrate” or “ppm nitrate-N”. Values can be entered for the first and, if available, second foot of the profile. By estimating the bulk density based on soil type and soil organic matter content (fig. 2), the tool then converts soil nitrate contents to lb N/ac. Only between 60% and 80% of the total nitrate-N is considered crop-available, with the value depending on the irrigation system. Figure 3 provides an example where a soil sample was collected from the top foot of the profile and a lab analysis revealed a nitrate-N concentration of 12 ppm. In this furrow-irrigated field with a loamy texture and 2.5% soil organic matter, an estimated 27 lb N/ac are taken up by the corn plants from the residual nitrate pool.
The tool assumes that less nitrate-N is available with irrigation systems that tend to have a lower ratio of water used by the crop versus total water applied (e.g., flood irrigation) and is more available with irrigation systems that potentially have a higher ratio, such as drip irrigation. One exception is the availability of residual nitrate in the topsoil of subsurface drip-irrigated fields. In these fields, the soil surface commonly dries out quickly in spring and mobile salts, including nitrate, can accumulate near the shoulder of the bed. Root growth and nutrient uptake can be limited in dry and salty soils. For this reason, the assumed residual nitrate availability has been adjusted in the calculator and reduced in the top foot of subsurface drip-irrigated fields.
In the background, the tool calculates regional ET value of the crop for the entire growing season based on California Irrigation Management Information System (CIMIS) data averages. The amount of water required to meet ET is used together with the user-entered irrigation water nitrate concentration to calculate lb N/ac applied with the irrigation water and credited to crop uptake. This approach relies on two assumptions. First, the crop is not deficit irrigated, and second, that nitrate in water applied in excess of ET is not taken up by the crop. In figure 3, 5 ppm of nitrate-N in the irrigation water contributes 21 lb N/ac of the total amount of N taken up by the corn.
The tool allows users to enter a pre-plant or starter fertilizer application. Some popular liquid starter fertilizers can be selected from the drop-down menu. When the fertilizer used is not listed, the amount of N applied can be entered in “lb N/ac”. In this case it is important to enter the amount of N applied and not the amount of fertilizer material. In our example, we assumed that 25 lb N/ac were applied with a starter fertilizer.
Nitrogen mineralization during the growing season is estimated by considering soil properties (texture and soil organic matter content), length of the growing season, and soil temperature. Soil temperature is based on daily average values measured at local CIMIS stations between planting and harvest. Microbial activity and N mineralization increase with increasing temperature (Miller and Geisseler 2018). Therefore, N mineralization is initially lower for a crop planted in early spring when the soil is still relatively cool, compared to a crop planted in late spring. In our example, corn will take up 47 lb N/ac derived from N mineralization during the growing season. In figure 3, the curve showing N from soil and irrigation water ends before the harvest date. This is because there is little N uptake during the last few weeks before grain corn harvest (fig. 1). Therefore, during this time, little of the irrigation water and mineralized N is taken up, so these are not included in the total.
Combined, these N credits contribute 120 lb N/ac to the total amount of N taken up by the corn in our example. With crop N uptake being 197 lb N/ac, 77 lb N/ac need to be supplied by in-season fertilizer. Because not every pound of fertilizer N is taken up by crops, the tool adjusts the amount of fertilizer N needed based on common N use efficiency values for the irrigation system, which range from 60% for flood irrigation to 80% for drip irrigation. In our example, the N use efficiency of furrow-irrigated corn is assumed to be 70% (fig. 3). In practice, however, this value is variable depending on site-specific conditions. Therefore, 110 lb N/ac need to be applied with fertilizer (77 lb N/ac divided by 0.7). For drip-irrigated fields, the calculator makes suggestions for weekly fertigations — applying fertilizer by blending it with irrigation water.
Conclusions
Calculating a site-specific N budget can be challenging as crop N demand, N availability from non-fertilizer sources and fertilizer use efficiency all need to be considered. To facilitate calculating the need for fertilizer N, we have developed an online tool that can support N fertilization practices based on field-specific input. The tool includes crop N demand, N available from non-fertilizer sources and N use efficiency. Economic considerations, such as the cost for fertilizer and crop prices, are currently not included but are other important factors that affect growers’ decisions about N application rates. The tool is easy to use and requires few site-specific inputs. However, this tool is based on average values from commercial fields and cannot capture all the factors that affect crop growth and yield. Therefore, it is essential to monitor a field during the growing season. Soil nitrate testing and/or plant tissue analyses are valuable tools to determine N availability and crop N status. Monitoring the field allows for adjustments when the calculated N application rate does not match the crops’ demand.
Acknowledgments
Funding for this project was provided by the CDFA Fertilizer Research and Education Program (FREP). We would like to thank the growers who let us set up trials in their fields and the numerous people who helped with sampling in the field and sample analyses.