


Rice (Oryza sativa L.) is an important crop in the Sacramento Valley of California, with 540,000 acres planted in 2016 (National Agricultural Statistics Service 2018). Weedy rice (Oryza sativa L. spp.) is a major weed in rice-growing regions around the world and can result in large yield losses and reduced rice value — up to 49% yield loss in the southern United States (Shivrain et al. 2009). Weedy rice is the same species as cultivated rice, and its similarities to cultivated rice can make it difficult to identify and control. Weedy rice is currently a growing issue in California rice production. Historically, weedy rice was present in rice culture in California as early as the 1920s (Bellue 1932), but adoption of a continuously flooded system and use of certified weed-free seed led to the virtual elimination of the weed in the 1950s (Miller and Brandon 1979). However, weedy rice was identified in a dry-seeded field in California in 2003 and has now been identified in over 60 fields as of 2020, infesting at least 20,000 acres in Butte, Colusa, Glenn, Sacramento, San Joaquin, Sutter, Placer, Yolo, and Yuba counties (Luis Espino, personal communication).
California weedy rice is currently classified into five major biotypes. These biotypes can be distinguished from most California rice before flowering by their tall plant height and yellow-green color, and pubescent leaves (Karn et al. 2020b). After flowering, they can be distinguished by the presence of red-pericarped seeds and, for some weedy biotypes, by long awns and bronze or black rice hulls (Karn et al. 2020b). Some biotypes exhibit high seed shattering and seed dormancy, leading to persistent seed banks and infestations in future years. These weedy rice biotypes are not very closely related to California rice varieties, and most of them likely originated outside of California (De Leon et al. 2019). Greenhouse studies of these biotypes indicate that yield losses due to California weedy rice are similar for all biotypes, and could be as high as 83% for heavy infestations if left uncontrolled (Karn et al. 2020a).
Due to its close relationship with cultivated rice, herbicides that control weedy rice also kill the crop, and herbicide-tolerant rice varieties are not available to California rice growers. Current management of weedy rice focuses on the adoption of cultural practices and policies to limit the spread of weedy rice. Weedy rice infestations can be prevented by planting weed-free seed and by cleaning equipment moved from areas with known weedy rice infestations. If weedy rice is already present in a field, removal of identified weedy rice plants before harvest, harvesting infested fields last to reduce contamination by equipment, winter flooding or straw burning if possible, and fallowing or crop rotation if possible, can help limit the spread of weedy rice and reduce infestations in future years (UCCE 2023).
Before this study, little was known about how widely these management practices were used by rice growers and pest control advisors, or about their perceptions of weedy rice. In 2019, we conducted a survey of rice growers and field managers to examine the extent of production practices that may affect weedy rice infestation levels and assess perceptions of the weedy rice problem in California. We collected information on rice production practices, perception of weedy rice compared to other problematic weeds, herbicide use, confidence in identifying weedy rice plants, whether weedy rice is currently present on farmed acreage, and use of methods for the prevention of weedy rice infestations. Our goal was to gather knowledge that would aid in University of California (UC) research and extension activities and the development of better prevention and management practices. To our knowledge, this is the first survey of its kind conducted in California. While the survey was focused on management in relation to weedy rice, the results may also be useful for understanding current rice management practices in general.
Methods
Survey methods
Physical mailing addresses for rice growers were obtained from UC Cooperative Extension (UCCE) rice farm advisors and county agricultural commissioners’ offices in the major rice-producing counties (Butte, Colusa, Glenn, Sacramento, San Joaquin, Sutter, Placer, Yolo, and Yuba). The lists were combined into one list, and duplicates were removed. The California Rice Commission also emailed a link to the online survey to their email list, which includes all rice operations in California. The survey questionnaire was designed as a single-mode survey, as it was delivered via mail to one group and via email to a second group (Dillman et al. 2014). A total of 1,253 mail-in surveys were delivered through the U.S. Postal Service. A total of 851 emails with the link to complete the online survey were delivered by the California Rice Commission.
Multiple survey drafts were reviewed with farm advisors and UCCE staff. A draft questionnaire was disseminated to a small group of rice growers, pest control advisors (PCAs), and UCCE staff to improve the clarity of the questions as well as to determine the amount of time needed to complete the survey. Once the survey questions were finalized, the questionnaire was translated to an online survey platform (Qualtrics, Provo, Utah) and delivered via email.
The questionnaire consisted of instructions, 20 questions, and an open-response section. The instructions stated that the respondents should answer the questions based on the 2018 rice growing season. The survey consisted of four sections: (1) demographic, (2) weedy rice, (3) pest management, and (4) other questions. In the online format, recipients were given the option to continue with the survey or to decline to participate. Closed questions for the multiple-choice questions were used to limit irrelevant data (Dillman et al. 2014). An open-response section was provided to allow respondents to relay any comments or concerns that UCCE could address in the future.
Survey design
The UC Davis Institutional Review Board approved the survey design and protocol. Pre-notice letters and emails were sent to recipients describing the objectives of the survey and informing them that they would be receiving a survey about weedy rice. On February 26, 2019, the pre-notice letter was mailed to 1,253 contacts. On March 6, 2019, a detailed letter explaining the objectives of the survey, the questionnaire, and pre-stamped, self-addressed return envelopes were mailed to 1,253 contacts. A follow-up reminder/thank you postcard was mailed during the week of March 15, 2019. The link to the published survey on Qualtrics was emailed by the California Rice Commission on March 6, 2019. A follow-up email reminder was sent out on April 1, 2019.
Out of the 1,253 paper surveys distributed, 24 surveys were returned by recipients stating that they did not grow rice, and one paper survey was refused by a respondent. Two hundred and thirty-seven surveys were returned as undeliverable or unable to forward by the U.S. Postal Service. Since the status of these addresses was unknown, a total of 1,229 paper surveys were received by valid recipients. A total of 120 mail-in surveys were completed and mailed back, for a return rate of 9.8%. Out of the 851 emails, 39 survey responses were received. One respondent declined to participate in the study, and another respondent was not a rice grower; therefore, 37 online surveys were completed for a return rate of 4.4%. A total of 157 surveys were completed out of 2,080 surveys distributed between March and June 2019, with a return rate of 7.5%. Not all the respondents answered all of the questions within the survey, as they were given the freedom to opt out of answering any questions they did not want to or if they did not know the answer.
Results and discussion
Respondent demographics
Responses were received from individuals who were rice growers, PCAs, both rice growers and PCAs, or “other” (table 1). The unit of analysis was considered to be one person, regardless of how they identified themselves; thus, there was potential for double-reporting of some acreage if a PCA and a grower reported on the same piece of land. The respondents who reported “other” claimed that they were pest control officers (n = 2) and a researcher (n = 1). The average age of the respondents who completed the survey was 58, and ages ranged from 25 to 92 years old.
Rice production systems
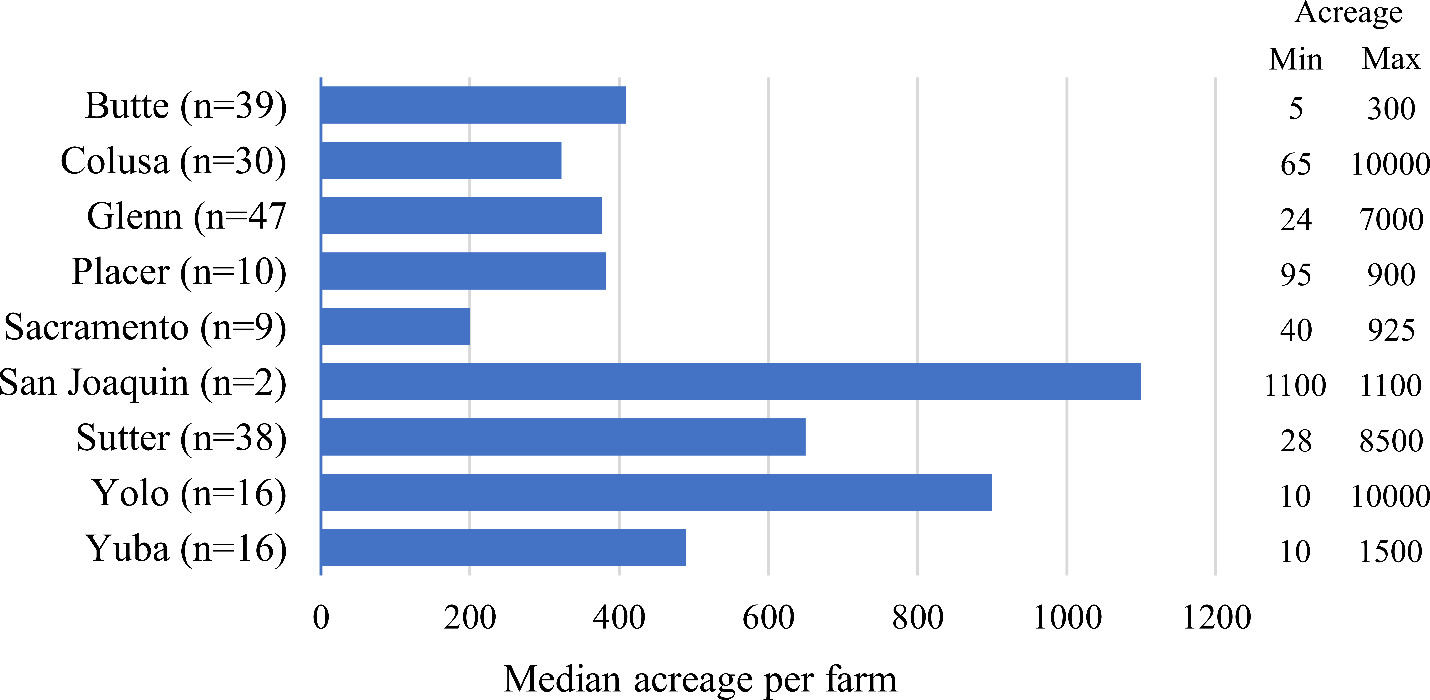
The survey responses were received from all major rice-producing counties in California (Butte, Colusa, Glenn, Sacramento, San Joaquin, Sutter, Placer, Yolo, and Yuba). The median amount of land managed by survey respondents was 627 acres, with an average of 1,157.6 acres and a range of 5 to 10,000 acres per respondent (fig. 1). A total of 180,000 rice acres were managed by respondents of the survey, about 36% of the total California rice acreage in 2018 (fig. 1).
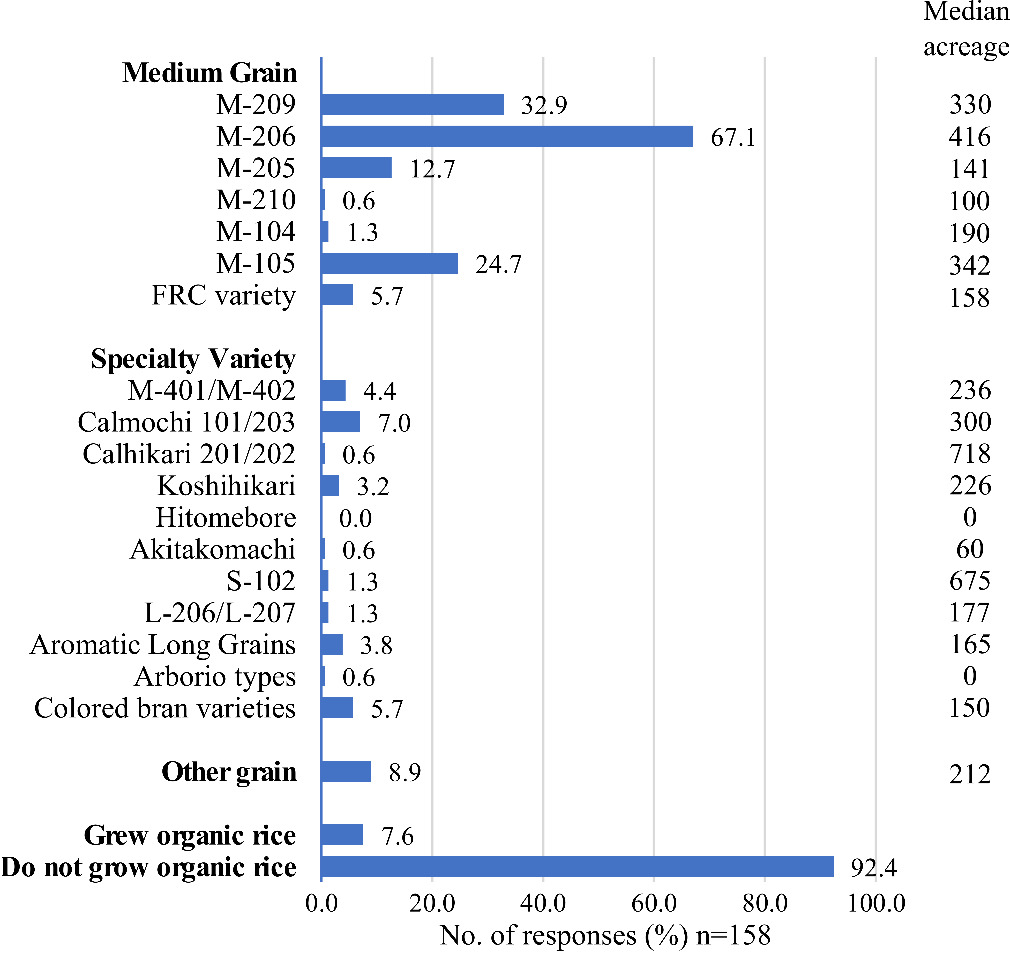
The respondents of this survey reported at least 25 different grain varieties (both medium grain and specialty varieties) that were grown in the 2018 rice season (fig. 2). The medium grain M-206 was the most common type of medium grain variety that was grown throughout the major rice-producing counties, with 67.1% of respondents and a median acreage of 416 acres. Calmochi 101/203 was the most common type of special variety grain, with 7% of respondents and a median acreage of 300 acres. Ninety-two percent of 145 responses stated that they did not grow organic rice, and 8% declared that they did grow organic rice. Out of the 152 responses, the majority of the respondents purchased certified or registered seed (93%), followed by saving their own seed (6%) and obtaining non-certified seed from other growers (3%). Some respondents (4%) reported obtaining seed from multiple sources.
Farming practices
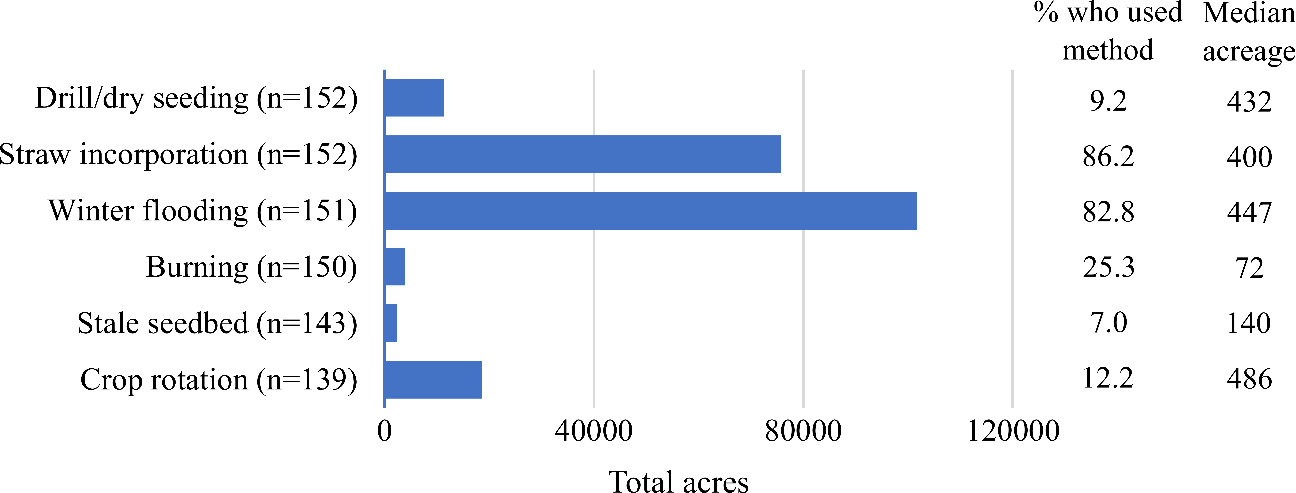
We asked survey respondents about a variety of farming practices, including the acreage on which those practices were utilized, and frequency or duration of some practices (fig. 3). All of the surveyed practices were thought to be associated with either a reduction or an increase in weedy rice prevalence. These practices included drill seeding/dry seeding (increase in prevalence in comparison to flooding), straw incorporation (increase in prevalence), winter flooding (decrease in prevalence), and burning practices (decrease in prevalence).
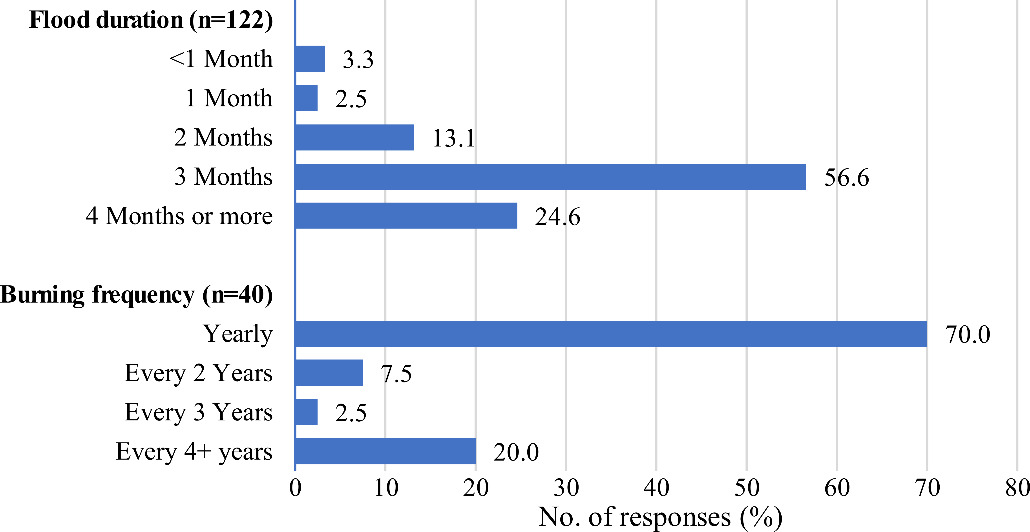
In the 2018 rice season, out of 152 responses, 9% used drill seeding or dry seeding as their planting method on a median of 432 acres. The drill seeding/dry seeding method was implemented on a total of 11,346 acres across all respondents (6.3% of the total acreage represented in this survey). Out of 152 responses, 86% of the respondents incorporated straw after their harvest on a median of 400 acres. Straw was incorporated on a total of 75,840 acres, 42% of the survey total acreage. From 151 responses, 83% of respondents said that they participated in winter flooding on a median of 447 acres, for a total of 101,863 acres (57% of the survey total acreage). Out of 122 responses, most of the respondents (56.6%) stated that they flooded their lands for at least 3 months (fig. 4). One-fourth (25% of 150 respondents) burned their rice straw (fig. 3) on a median of 72 acres, for a total of 3,874 acres (2.2% of survey total acreage). Forty respondents (70%) stated that they burned their land yearly (fig. 4).
Weed management
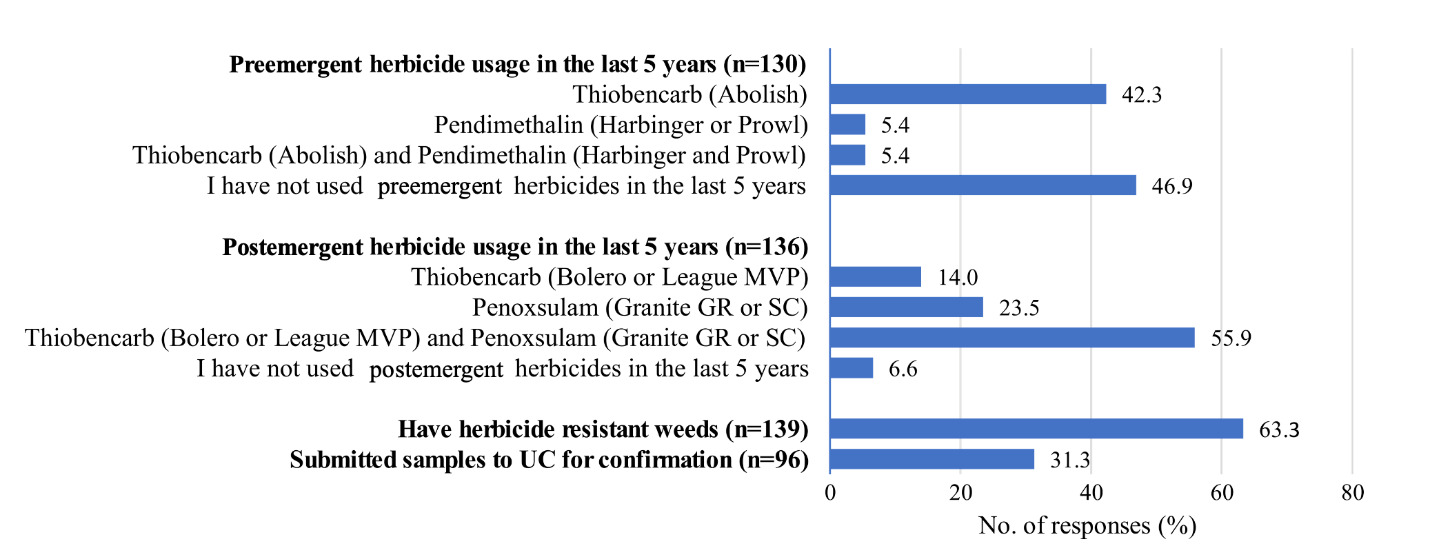
When respondents were asked about problematic weeds, watergrass was ranked number one (out of nine species), whereas weedy rice was ranked last (table 2). Among respondents who had weedy rice on land they managed, weedy rice ranked seventh. Although weedy rice is known to be a problematic weed of rice worldwide, the purpose of this survey was to gauge grower perception in California. Other species the respondents mentioned as write-in choices included sprangletop, smartweed, monochoria, water plantain, sage, and cattails. Respondents were asked about their usage of certain pesticides which were thought to make weedy rice more difficult to distinguish from rice varieties, via their ability to shorten and darken rice, as one of the visual markers of weedy rice is its taller height and lighter color (Karn et al. 2020b). Out of the 130 responses, 53.1% of respondents stated that they used the preemergent herbicides thiobencarb (Abolish), pendimethalin (Harbinger or Prowl), or both, while 46.9% of the respondents stated that they have not used preemergent herbicides in the last 5 years (fig. 5). For postemergence herbicides, 128 participants out of 136 responses stated that they have used thiobencarb (Bolero or League MVP), penoxsulam (Granite GR or SC), or both in the last 5 years, while nine respondents stated they have not used any postemergence herbicides in the last 5 years.

Respondents were also asked about the presence of herbicide-resistant weeds, which would also make weedy rice more challenging to identify in the field, especially in fields highly infested with resistant watergrass species (Echinochloa spp.) (UCCE 2023). Respondents were asked about the number of suspected resistant samples sent to the UC, which may be an indicator of their attention to scouting their fields on a regular basis. Eighty-eight (63.3%) respondents stated that they do have herbicide-resistant weeds on a median of 150 acres, ranging from 0.5 to 3250 acres. However, only 30 respondents (31.3%) have submitted samples to the UC to verify resistance.
Respondents were asked about farming methods such as the stale seedbed method and crop rotation, both recommended practices thought to reduce weedy rice prevalence (UCCE 2023). Out of the 143 survey respondents who answered this question, only 10 (7%) utilized the stale seedbed method for controlling weeds (fig. 3). This method was utilized on a median of 140 acres, totaling 2,450 acres (1.4% of survey total acreage). Seventeen survey responses noted that they use crop rotation (fig. 3) on a median of 486 acres, for a total of 18,681 acres (10% of survey total acreage). Of respondents who rotated crops, the most common crops planted alternately with rice were sunflowers (10), tomatoes (eight), wheat (five), and safflower (four), and smaller numbers of respondents reported vetch, corn, bell beans, forage hay, oatseed, pea seed, vineseed (melon seed), melons, grain, dry beans, barley, wild rice, or fallow. Of respondents who did not rotate crops, the cited reasons were soil type (79), field layout (48), marketability of rotation crops (46), lack of equipment/resources (32), and other (33), which included write-in responses regarding landlord/lease agreements, small acreage, water shortages or flooding, and alternative winter land use (e.g., duck hunting).
Weedy rice
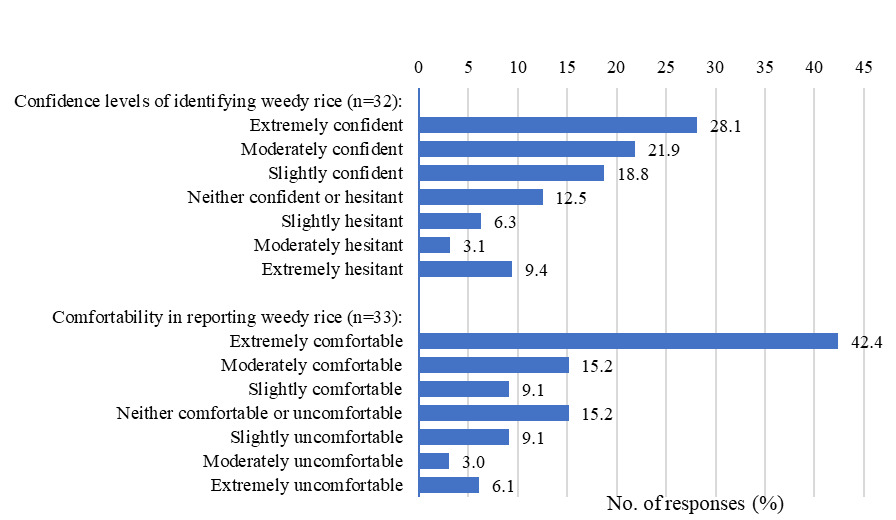
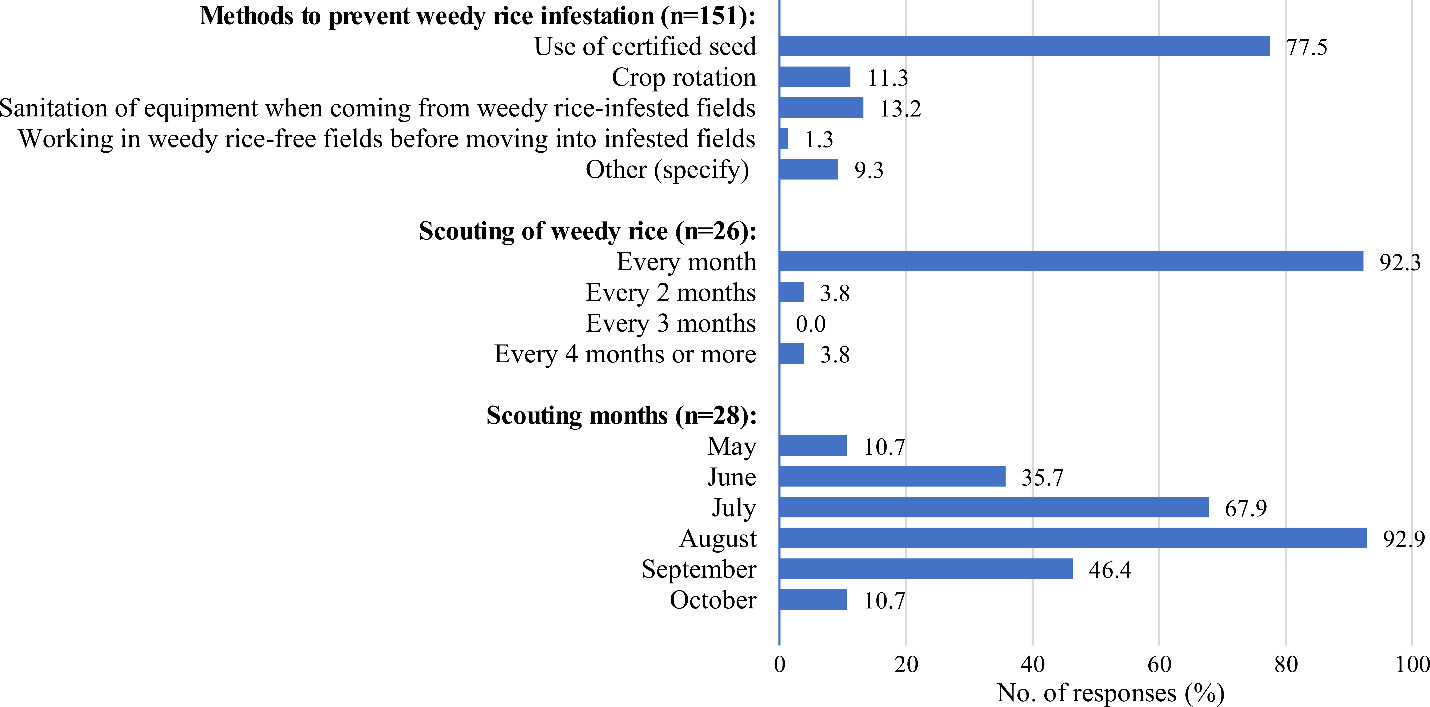
Some respondents (32) shared their perspective about their ability to identify weedy rice. Sixteen of the 32 were moderately or extremely confident in their ability to identify weedy rice, while four were moderately or extremely hesitant (fig. 6). A small majority (57%) of the 33 who responded to this question stated that they were moderately to extremely comfortable with reporting the presence of weedy rice. However, the rest stated they would most likely not report the presence of weedy rice, probably due to the negative social stigma associated with its presence (from others in the rice industry). Nineteen were moderately or extremely comfortable reporting the presence of weedy rice, while three were moderately or extremely uncomfortable (the remaining 12 fell somewhere in between). Of the methods used by 148 participants who listed the methods they use to prevent weedy rice from infesting their fields, the top three methods were (1) the use of certified seed (77.5%), (2) sanitation of equipment when moving from weedy rice-infested fields (13%), and (3) crop rotation (11%) (fig. 7). Some participants used several of these methods. Out of the 26 survey responses, 24 respondents said that they scout for weedy rice every month, and the most common month during which the respondents scouted in the 2018 rice season was August, when rice is heading and weedy rice is easiest to distinguish from cultivated varieties.


The eight respondents with weedy rice infestations farmed a median of 150 acres containing weedy rice, ranging from 12 to 1,000 acres. These respondents had weedy rice on an average of 26% of their total rice acreage. The total reported acreage of fields containing weedy rice in this survey was 1,637 acres, 0.9% of the 180,000 rice acres represented by this survey. For comparison, the total estimated acreage of fields infested with weedy rice in California was 20,000 acres in 2020 (Luis Espino, personal communication), about 3.7% of the total statewide rice acreage. A total of eight respondents stated that they farmed on rice fields infested with weedy rice, and a total of 12 respondents described the density of weedy rice populations in their fields (table 3). Out of the 12 responses describing weedy rice infestations, eight respondents had light populations (one patch per field), and four respondents had moderate populations (sparse patches per field). On average, respondents reported that they have had weedy rice in their fields for 2.8 years, with a range of 1 to 6 years. Of the 12 growers who reported farming weedy rice–infested fields, six ranked weedy rice as one of their five worst weeds, and none ranked it as their top worst weed (table 2). Of 11 respondents who responded with the methods they use to manage weedy rice, seven use hand-rogueing, five use spraying, three use crop rotation, and two use fallowing (table 3). Some respondents responded with multiple methods.
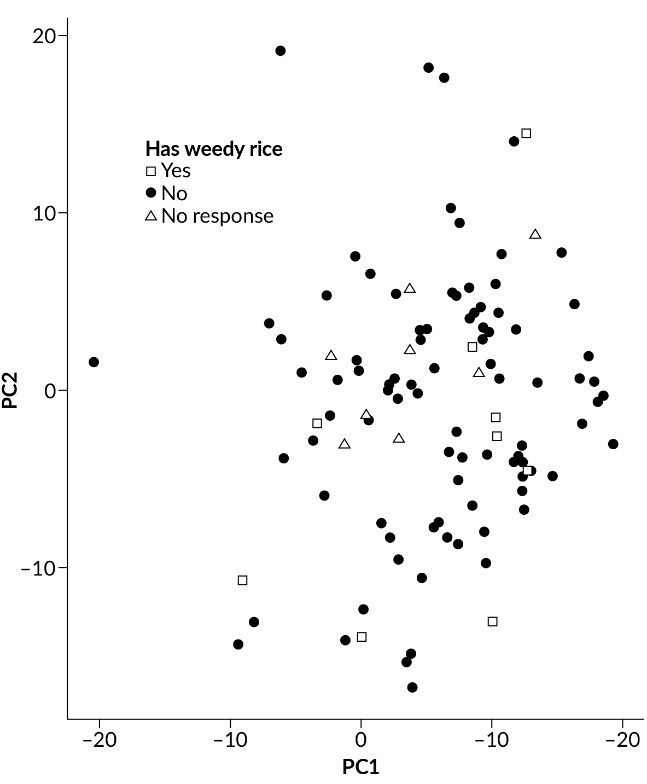
The presence of weedy rice is not statistically related to any single rice management practice, as indicated by chi-square tests. The tested management practices and farm characteristics were large (> 1,000 acres) vs. small (< 1,000 acres) farm size, organic production, production of medium grain rice, production of specialty rice varieties, purchasing certified seed, saving seed, obtaining seed from other growers, use of specific preemergent herbicides, use of specific postemergence herbicides, drill/dry seeding, straw incorporation, winter burning, use of the stale seedbed method, and crop rotation. Additionally, a logistic principal component analysis of use of all management practices showed no clustering of respondents who managed farms with weedy rice (fig. 8). This means that growers who report having weedy rice on farms they manage do not have much in common in terms of rice management practices, and that no identified set of management practices (out of the practices listed in the survey) has contributed to existing weedy rice infestations.

While the responses to this survey did not show any statistically significant relationship between rice growing practices and presence of weedy rice, there was an almost significant relationship both for drill/dry seeding (P = 0.053) and use of preemergent herbicides (P = 0.051). This weak statistical connection may be a result of the small sample size and the low number of respondents with weedy rice. It is possible either that there is no real connection between these practices and the presence of weedy rice, or that these results would be significant with a larger sample size. More responses from growers with weedy rice would be needed to answer this question. It is possible that growers with weedy rice infestations did not participate in the survey. Drill/dry seeding could be associated weedy rice presence, as weedy rice does not emerge as well under flooded conditions as it does under dry conditions; this is well-known for drill-seeded rice in the southern United States as well as in Asia (Chauhan 2012). The decline of weedy rice in California rice in the 1950s was attributed to use of a continuous flood system in California (Miller and Brandon 1979); however, more recent data have shown that weedy rice in California can emerge under flooded conditions, although at lower rates than under dry or drill-seeded conditions (Galvin et al. 2022). Use of preemergent herbicides would not be expected to be related to weedy rice presence, as these herbicides are used for other weeds and would not be effective in controlling weedy rice, but since thiobencarb (Abolish) shortens and darkens rice due to its phytotoxic effects, its use may make it harder to distinguish weedy rice from cultivated rice in the field, making it less likely to be controlled. Furthermore, pendimethalin is only registered for use in drill/dry-seeded systems, which may indicate that the association is due to the seeding system, and not to the use of preemergence herbicides.
Overall, the results of this survey show that rice growers and PCAs in California use diverse management practices on farms with unique circumstances and challenges. This is the first survey of its kind conducted with California rice growers, and results could be useful in understanding current rice management practices and assessing future extension needs. Since the survey sample size was low, and there is a possibility that some land may have been reported twice due to the overlap of PCAs and growers reporting on the same land, this survey should be considered exploratory.
While this survey primarily targeted weedy rice, it also shed light on other areas of rice management. Currently, weedy rice is not widespread, and most growers do not view it as a serious concern. Even so, many are already taking steps to prevent its spread, efforts that will be important in keeping it from becoming a larger problem in the future.
Acknowledgments
Funding for this study was provided by the California Rice Commission. The authors would also like to acknowledge staff in the UCCE Sutter-Yuba office for assistance with mailing the survey.