This website uses cookies

We use cookies to enhance your experience and support COUNTER Metrics for transparent reporting of readership statistics. Cookie data is not sold to third parties or used for marketing purposes.

Skip to main content
California Agriculture
  • Menu
  • Articles
    • Announcement
    • Archive
    • Brief Report
    • Case Report
    • Correction
    • Editorial
    • In Brief
    • Introduction
    • Letter
    • News
    • Other
    • Outlook
    • Research Article
    • Research News
    • Review Article
    • All
  • For Authors
  • Editorial Board
  • About
  • Issues
  • Blog
  • Accepted Papers
  • archive
  • search
  • Bluesky (opens in a new tab)
  • Facebook (opens in a new tab)
  • RSS feed (opens a modal with a link to feed)

RSS Feed

Enter the URL below into your favorite RSS reader.

https://californiaagriculture.org/feed
P-ISSN 0008-0845
E-ISSN 2160-8091
Research Article
June 08, 2026 PDT

Grassland biomass thresholds critical to fire behavior in California

Roxanne H. Foss, Matthew Wk. Shapero, Shane L. Dewees, Jeffery W. Stackhouse, Lenya N. Quinn-Davidson, Luke T. Macaulay,
Californiafire behaviorfuel managementgrasslandgrazing managementprescribed fireprescribed grazingrate of spreadresidual biomasswildfire
Copyright Logoccby-nc-nd-4.0 • https://doi.org/10.3733/001c.161847
California Agriculture
Foss, Roxanne H., Matthew Wk. Shapero, Shane L. Dewees, Jeffery W. Stackhouse, Lenya N. Quinn-Davidson, and Luke T. Macaulay. 2026. “Grassland Biomass Thresholds Critical to Fire Behavior in California.” California Agriculture: The Journal of UC Agriculture and Natural Resources, June 8. https://doi.org/10.3733/001c.161847.
Save article as...▾
Download all (10)
  • Fig. 1. Locations of nine prescribed burn study sites across California, where blocks of herbaceous biomass were mowed to mimic different grazing levels (2020 to 2022). From north to south, the sites are located in the following counties: Site F, Humboldt; G and E, Sonoma; B, Santa Cruz; A, San Luis Obispo; I and H, Santa Barbara; C and D, Madera County. Data sources: USGS (GAP, 1998; TIGER, 2012).
    Download
  • Fig. 2. Example block of biomass manipulation treatment strips replicated within prescribed burn study sites across California (2020 to 2022). The “>1,500 /acre” strip was untreated (up to 60,300 lb/acre).
    Download
  • Fig. 3. Predicted relationships (generalized linear model) between herbaceous biomass (lb/acre) and fire behavior metrics from prescribed burn study sites across California (2020 to 2022). Fire behavior metrics include flame height (A), average rate of spread (B), probability fire stops before 33 ft (10 m) (C), proportion of vegetation burned (D), surface temperature (E), and total white ash (F). All models except (B) (not significant) were significant at P < 0.001. Relationships are depicted with 95% confidence level intervals for predicted relationships.
    Download
  • Fig. 4. Conditional inference trees for fire behavior metrics from herbaceous biomass treatments within prescribed burn study sites across California (2020 to 2022). Fire behavior metrics include proportion of treatments where flame height reached 4 ft (1.2 m) (A) and proportion of treatments where fire stopped by 33 ft (10 m) (B).
    Download
  • Fig. 5. Average herbaceous biomass production and recommended fall biomass or residual dry matter (RDM) amounts (lb/acre) for grazed and ungrazed California vegetation zones as well as herbaceous biomass (lb/acre) thresholds related to fire behavior metrics observed at prescribed burn study sites across California (2020 to 2022). Minimum RDM values are from Bartolome et al. 2006. Average peak biomass and grazed and ungrazed RDM are from Ratcliff et al. 2022. North Coast is from Northern California Coastal (Point Reyes) data cited in Ratcliff et al. 2022.
    Download
  • Fig. 6. Example field in Santa Barbara County (California) with 3,140 lb/acre of herbaceous biomass (over 2,496 lb/acre threshold) representing ungrazed or very lightly grazed biomass where flame heights can exceed 4 ft. Photo: M. Shapero.
    Download
  • Fig. 7. Example field in Contra Costa County (California) with 1,918 lb/acre of herbaceous biomass (within 1,250 and 2,496 lb/acre range), representing light to moderately grazed biomass where flame heights are below 4 ft and fire will not be stopped. Photo: R. Foss.
    Download
  • Fig. 8. Example field in Ventura County (California) with 1,160 lb/acre of herbaceous biomass (within 1,250 and 384 lb/acre range), representing moderate to heavily grazed biomass where flame heights are below 4 ft and fire may be stopped. Photo: M. Shapero.
    Download
  • Fig. 9. Example field in San Joaquin County (California) with 315 lb/acre of herbaceous biomass (below 384 lb/acre threshold), representing very heavily grazed biomass where fire will be stopped. Photo: R. Foss.
    Download
  • Technical appendix
    Download

Error

Sorry, something went wrong. Please try again.

If this problem reoccurs, please contact Scholastica Support

Error message:

undefined

View more stats

Abstract

Anecdotal and fire behavior modeling evidence indicates that livestock grazing can reduce herbaceous fuels and improve ecosystem resilience in an era of expanding and intensifying wildfires. To quantify these effects in California, we established a statewide, multi-year (2020 to 2022) study manipulating herbaceous biomass levels within prescribed fire footprints to examine the relationship between herbaceous biomass levels and key fire behavior metrics. We identified multiple biomass thresholds that may be incorporated into land management and planning documents. Grasslands with fewer than 384 pounds (lb) per acre (43 grams per square meter [g/m²]) biomass had greater than 90% probability of stopping a fire before reaching 33 feet (ft) (10 meters [m]) while grasslands with biomass greater than 1,248 lb/acre (140 g/m²) had a near zero probability of stopping a fire before reaching 33 ft. Biomass values below 2,496 lb/acre (280 g/m²) had only a 3% probability of reaching 4 ft (1.2 m) flame height. These biomass thresholds and associated fire behavior metrics can be strategically employed to manage grasslands to protect California’s communities in the context of meeting other goals, including minimum residual dry matter standards.

The intensity, extent and frequency of wildfires have been increasing in California due to multiple factors (Steel et al. 2015; Stephens and Ruth 2005; Stephens et al. 2007). Livestock grazing is commonly used to reduce herbaceous and small diameter woody fuels at the landscape scale (Taylor 2006). Although some land management entities identify grazing as one of their primary landscape-level fire hazard reduction tools, typical grazing plans lack upper biomass thresholds that are related to goals for fire behavior (EBRPD 2013, 42).

Livestock alter fuel loads on rangelands by consuming herbaceous material, reducing the frequency and cover of woody plants, and by compacting and incorporating organic material into the soil (Taylor 2006). The amount of annual herbaceous biomass depends on inherent soil productivity and variable climatic factors within the growing season (Becchetti et al. 2016, 5). One California study used regional datasets to estimate that cattle (Bos taurus) grazing removes between 174 and 1,020 pounds per acre (lb/acre; 20 to 114 grams per square meter [g/m2]) of herbaceous biomass annually (Ratcliff et al. 2022, 64). This reduction in biomass has been directly tied to decreases in annual wildfires (Siegel et al. 2022).

An earlier study (Stechman 1983) assessed the impact of multiple vegetation management approaches, including grazing, on fire behavior, but grazing levels were not quantified beyond “moderate” grazing. Field-based manipulative studies in other regions have successfully demonstrated the effects of cattle grazing on rate of spread and flame length (Bruegger et al. 2016; Davies et al. 2010; 2015; Diamond et al. 2009; Orr et al. 2022; Schmelzer et al. 2014), but these are not directly applicable to the dominant California grassland types. Grasslands in the other studied regions, including California Floristic Province and Great Basin Province in northeastern California, are more often dominated by native perennial bunchgrasses adapted to colder high-elevation conditions compared to California grasslands, which are dominated by non-native annual and perennial grasses adapted to Mediterranean and coastal climatic conditions. This study aimed to inform land management and livestock grazing policy by identifying critical biomass thresholds that affect relevant fire behavior metrics in California.

Experimental study design

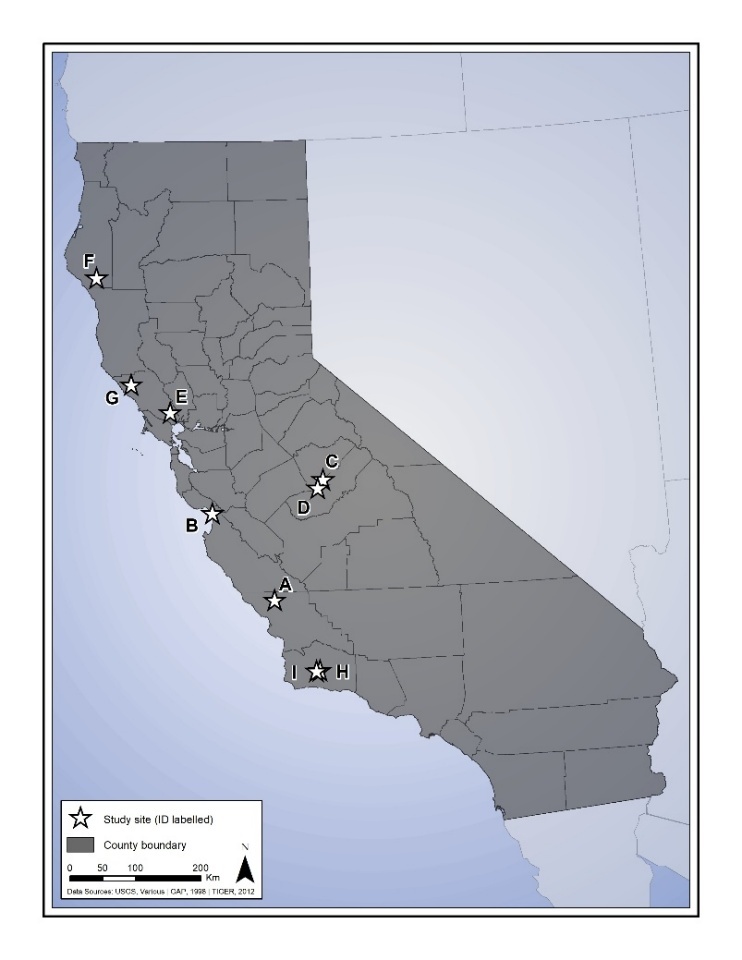
Our study assessed how a spectrum of herbaceous biomass affected fire behavior across 45 randomized blocks located within nine prescribed burn sites in California (fig. 1). Each 33-foot-by-21-foot (10-m-by-6.5-m) block had four treatments clipped with string trimmers and biomass raked off to mimic livestock grazing (fig. 2). Use of livestock to graze these levels was not feasible due to their small size, need for rapid implementation of treatments, and challenges in creating uniform treatment blocks.

A map of California has stars to indicate the location of each of the nine study sites.
Fig. 1.Locations of nine prescribed burn study sites across California, where blocks of herbaceous biomass were mowed to mimic different grazing levels (2020 to 2022). From north to south, the sites are located in the following counties: Site F, Humboldt; G and E, Sonoma; B, Santa Cruz; A, San Luis Obispo; I and H, Santa Barbara; C and D, Madera County. Data sources: USGS (GAP, 1998; TIGER, 2012).
Line drawing of the rectangular plot layout labeled "Top of Hill" at the top and "Bottom of Hill" at the bottom. The plot is 10 m long and 6.5 m wide. It contains four vertical treatment strips arranged side by side, each representing a different biomass range: 0--500, 500--1,000, 1,000--1,500, and greater than 1,500 lb/acre.
Fig. 2.Example block of biomass manipulation treatment strips replicated within prescribed burn study sites across California (2020 to 2022). The “>1,500 /acre” strip was untreated (up to 60,300 lb/acre).

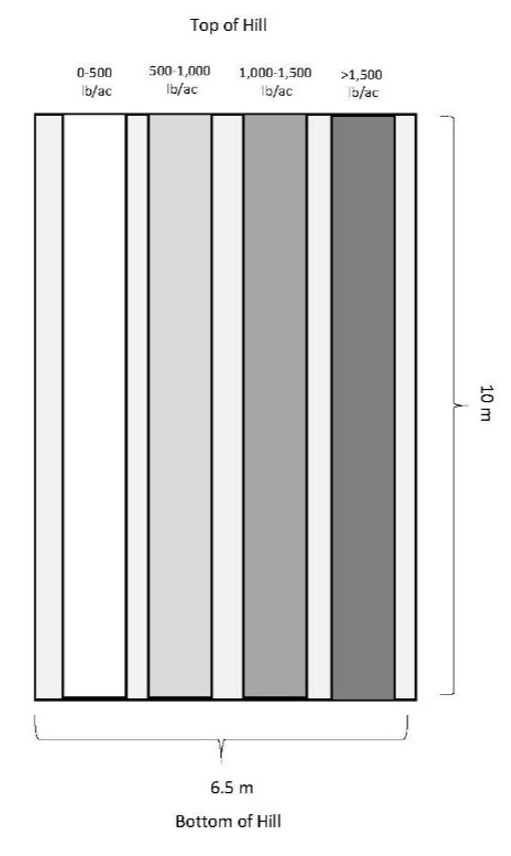
Treatments reflected typical grazing intensities: ungrazed or very lightly grazed (>1,500 lb/acre [168 g/m2]), light (1,000 to 1,500 lb/acre [112 to 168 g/m2]), moderate (500 to 1,000 lb/acre [56 to 112 g/m2]), and heavy (0 to 500 lb/acre [0 to 56 g/m2]). We clipped biomass from one representative sample of each treatment level of each block using standardized quadrats and weighed the sample in the field. We then dried these samples in a controlled environment and reweighed them to assess minimum dry weight, which was used in the analysis.

Our randomized complete block design included three block replicates within each available slope class: 0% to 10%, 10% to 20%, and 20% to 40% slopes (see table 1). The nine sites were categorized as coastal prairie (CP) or annual grassland-hardwood (AGH) grassland types (Barbour et al. 2007; Bartolome et al. 2006). AGH sites were dominated by wild oats (Avena spp.) and bromes (Bromus spp.) while CP sites had higher perennial grass cover (e.g., Elymus glaucus, Agrostis sp.).

Table 1.California vegetation (CALVEG) zone (USDA 2011), season, year, slope classes (1 = 0%–10%; 2 = 10%–20%; 3 = 20%–40%), grassland type (Bartolome et al. 2006), ambient temperature (°C), relative humidity (%), and notes for each prescribed burn study site. Grassland types include the following: AGH = annual grassland-hardwood; CP = coastal prairie. Ambient temperature and relative humidity data reported were documented on the burn day.
CALVEG mapping zone Site Season of burn Year Slope class(es) Grassland type Ambient temperature (°C) Relative humidity (%) Notes
Central Coast and Montane A Spring 2022 1; 3 AGH 32 24 —
B Summer 2021 1; 2 AGH 18 71 —
Central Valley C Spring 2021 1 AGH 27 13 —
D Spring 2022 1; 2 AGH 27 29 —
North Coast E Spring 2020 1 AGH 19 32 Tempilaq strips excluded; no flame height taken
F Summer 2021 1 CP 23 56 —
G Summer 2021 2; 3 CP 21 55 —
South Coast and Montane H Fall 2020 1; 3 AGH 28 40 No flame height taken
I Spring 2022 1 AGH 28 45 —

Three aluminum metal tags painted with temperature-sensitive paints (Tempilaq) were placed within each treatment to estimate maximum soil surface temperature during the burn; paint thresholds ranged from 225°F to 650°F (107°C to 343°C) (Iverson et al. 2004). Before and after each burn, we conducted 33-ft (10-m) point intercept transects, recording cover type every 4 inches (10 centimeters [cm]) along the midline of each treatment to assess cover classes: grass, forb, thatch, bare ground, rock, and ash (Caratti et al. 2006).

Blocks were ignited along the lowest elevation of the block and/or downwind to mimic natural fire movement up hills and with the wind. During the burn, we recorded wind speed and direction, relative humidity, and ambient temperature at regular intervals. We recorded time for the fire line to move from 0 to 16 ft (0 to 5 m) and from 16 to 33 ft (5 to 10 m), and approximate flame height (measured in feet) at 0, 16, and 33 ft (0, 5, and 10 m, respectively) along the linear treatments. We took photographs and videos at critical intervals to document fire characteristics at the 0-, 16-, and 33-ft (0-, 5-, and 10-m) points (Stephens et al. 2008, 77–78).

Data analysis

First, to examine the specific relationship (both shape and significance), between biomass and fire behavior, we ran generalized linear models, accounting for the non-normal data distribution, using R Statistical Software (R Development Core Team 2008). We fit univariate (biomass) generalized linear models with appropriate error distributions (gamma or binomial) and link functions for each measured fire behavior metric (table 2). Then, to identify specific biomass thresholds and evaluate the role of the other measured independent variables, we generated decision trees using the ctree function in the partykit package.

Table 2.Range of observed values, statistical family, intercept, coefficient estimate, significance, and variance explained (%) for dependent fire behavior variables with biomass manipulation as the independent variable in a generalized linear model for grassland burns across California (2020 to 2022). Rate of spread had one outlier excluded.
Dependent variable Range of values Statistical family Intercept / coefficient estimate Significance (P-value) Variance explained (%)
Maximum flame height 0.08 to 9.00 ft Gamma 0.645 / −0.008 ≤ 0.001 16
Rate of spread 0.01 to 1.56 m/s Gamma 8.284 / 0.003 Not significant 0
Stopped by 10 m 0 or 1 Binomial 2.070 / −0.339 ≤ 0.001 39
Total burned 0 to 1 (proportion) Binomial −0.829 / 0.146 ≤ 0.001 39
Surface temperature 225°F to 650°F (107°C to 343°C) Gamma 2.304e-03 / −1.233e-05 ≤ 0.001 10
White ash 0 to 0.56 (proportion) Binomial −3.285 / 0.024 ≤ 0.001 8

These decision trees included all independent variables (i.e., season, CALVEG zone, slope class, biomass, burn direction, average relative humidity during the burn, and average wind speed during the burn) as inputs the model could choose from to best partition the data. Importantly, variables included as an input in the model may not show up in the final decision tree. Only variables that significantly partition the dependent variable are included in the final tree. We ran two decision trees with management focused outcomes (did flame lengths reach 10 ft and did fire stop by 33 ft) to make the identified thresholds most applicable.

Biomass relationships with fire metrics

Generalized linear models with biomass as a continuous variable

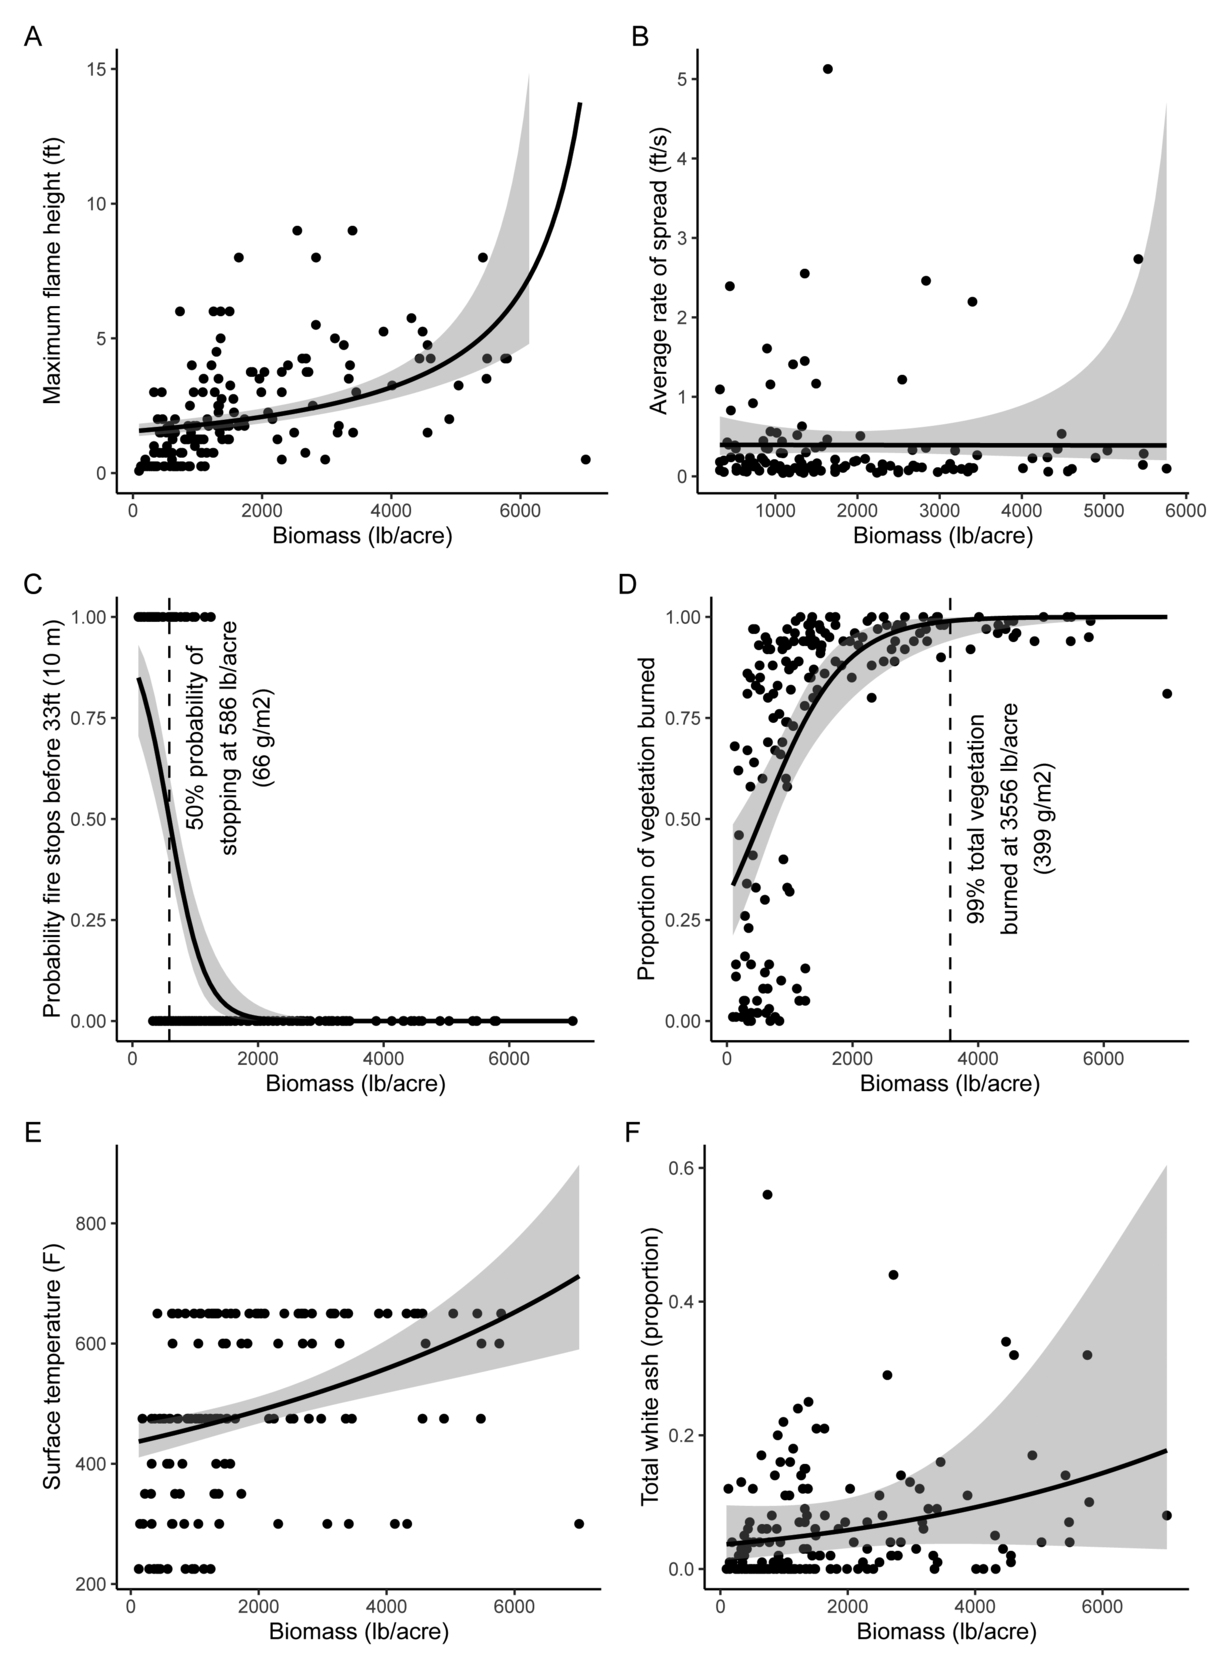
Generalized linear models (glms) showed significant relationships existed between biomass as a continuous variable (fig. 3) and multiple fire behavior metrics (table 2): maximum flame height (fig. 3A), stopping by 33 ft (10 m) (fig. 3C), proportion burned vegetation (fig. 3D), surface temperature (fig. 3E), and white ash cover (fig. 3F). We did not observe a significant relationship between biomass and rate of spread (fig. 3B). Furthermore, these models revealed two potential biomass thresholds: fuel loads above 586 lb/acre (66 g/m2) have a greater than 50% probability of spreading past 33 ft (10 m) and fuel loads above 3,556 lb/acre (399 g/m2) have 99% of their biomass consumed by fire.

Six-panel figure (A--F) showing relationships between biomass (lb/acre, x-axis in all panels) and fire or vegetation metrics (y-axes vary), with scatter points, fitted curves, and shaded confidence intervals. A) Maximum flame height (ft) increases gradually at low biomass and rises sharply at high biomass. B) Average rate of spread (ft/s) remains relatively low across most biomass levels. C) Probability fire stops before 33 ft (10 m) decreases rapidly as biomass increases, near 50% probability of stopping at ~586 lb/acre. D) Proportion of vegetation burned increases with biomass, approaching near-total burn (~99%) around ~3,556 lb/acre. E) Surface temperature (°F) increases with biomass, with wide variability. F) Total white ash proportion increases slightly with biomass but remains low overall.
Fig. 3.Predicted relationships (generalized linear model) between herbaceous biomass (lb/acre) and fire behavior metrics from prescribed burn study sites across California (2020 to 2022). Fire behavior metrics include flame height (A), average rate of spread (B), probability fire stops before 33 ft (10 m) (C), proportion of vegetation burned (D), surface temperature (E), and total white ash (F). All models except (B) (not significant) were significant at P < 0.001. Relationships are depicted with 95% confidence level intervals for predicted relationships.

Decision tree analysis identifying biomass thresholds

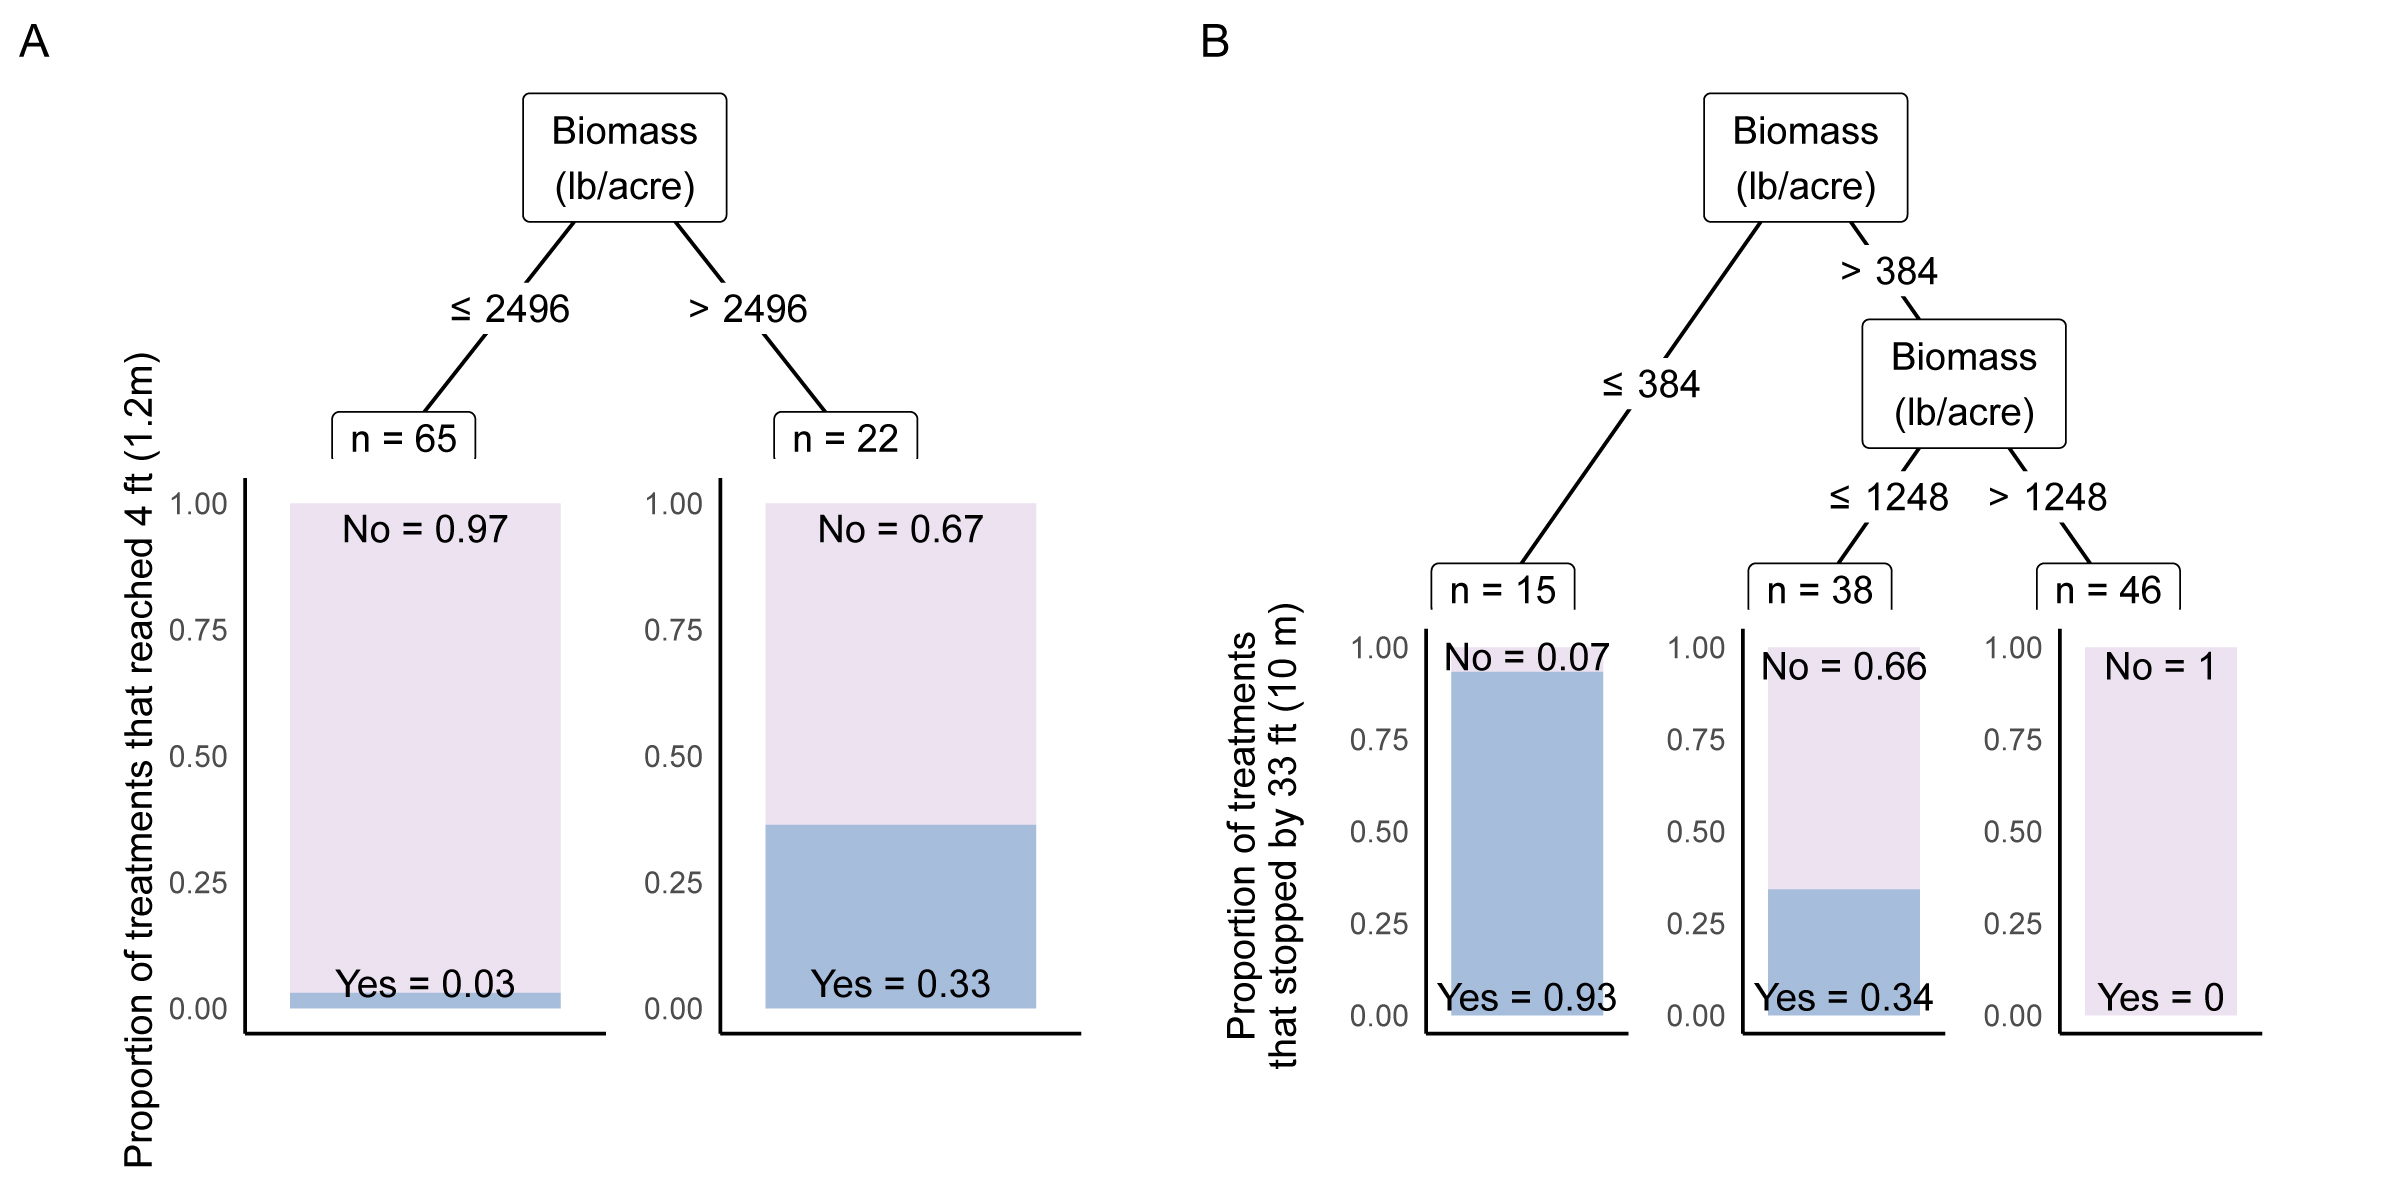
In the decision tree analyses, biomass was the only independent variable included in both developed trees. This means that (1) biomass has the strongest association with the dependent variables, and (2) none of the other included variables meaningfully explain the remaining variance/uncertainty in the data. For the decision tree determining whether a fire had 4-ft (1.2-m) flame heights, there was one node with a split threshold of 2,496 lb/acre (280 g/m2). Flame lengths almost never reached 4 ft (3%) under that threshold (fig. 4A). For the probability of stopping fire, the first node split at 384 lb/acre (43 g/m2); 93% of fires stopped by 33 ft under that biomass threshold. A second node split at 1,248 lb/acre (140 g/m2), with only 34% of fires stopping by 33 ft in the 1,248 to 2,496 lb/acre biomass range. Above 2,496 lb/acre, no fires stopped by 33 ft (fig. 4B).

Two-panel figure showing conditional inference trees linking herbaceous biomass (lb/acre) to fire behavior outcomes from prescribed burns in California (2020--2022). A) Proportion of treatments where flame height reached 4 ft (1.2 m). Biomass splits at 2,496 lb/acre. Less than or equal to 2,496 lb/acre (n = 65): 97% of treatments reached greater than or equal to 4 ft flame height. Greater than 2,496 lb/acre (n = 22): 67% of treatments reached greater than or equal to 4 ft. B) Proportion of treatments where fire stopped by 33 ft (10 m). Biomass splits at 384 lb/acre, then at 1,248 lb/acre. Less than or equal to 384 lb/acre (n = 15): 93% of fires stopped by 33 ft. 384--1,248 lb/acre (n = 38): 34% of fires stopped by 33 ft. Greater than 1,248 lb/acre (n = 46): 0% of fires stopped by 33 ft.
Fig. 4.Conditional inference trees for fire behavior metrics from herbaceous biomass treatments within prescribed burn study sites across California (2020 to 2022). Fire behavior metrics include proportion of treatments where flame height reached 4 ft (1.2 m) (A) and proportion of treatments where fire stopped by 33 ft (10 m) (B).

Discussion

Thresholds in the context of other goals

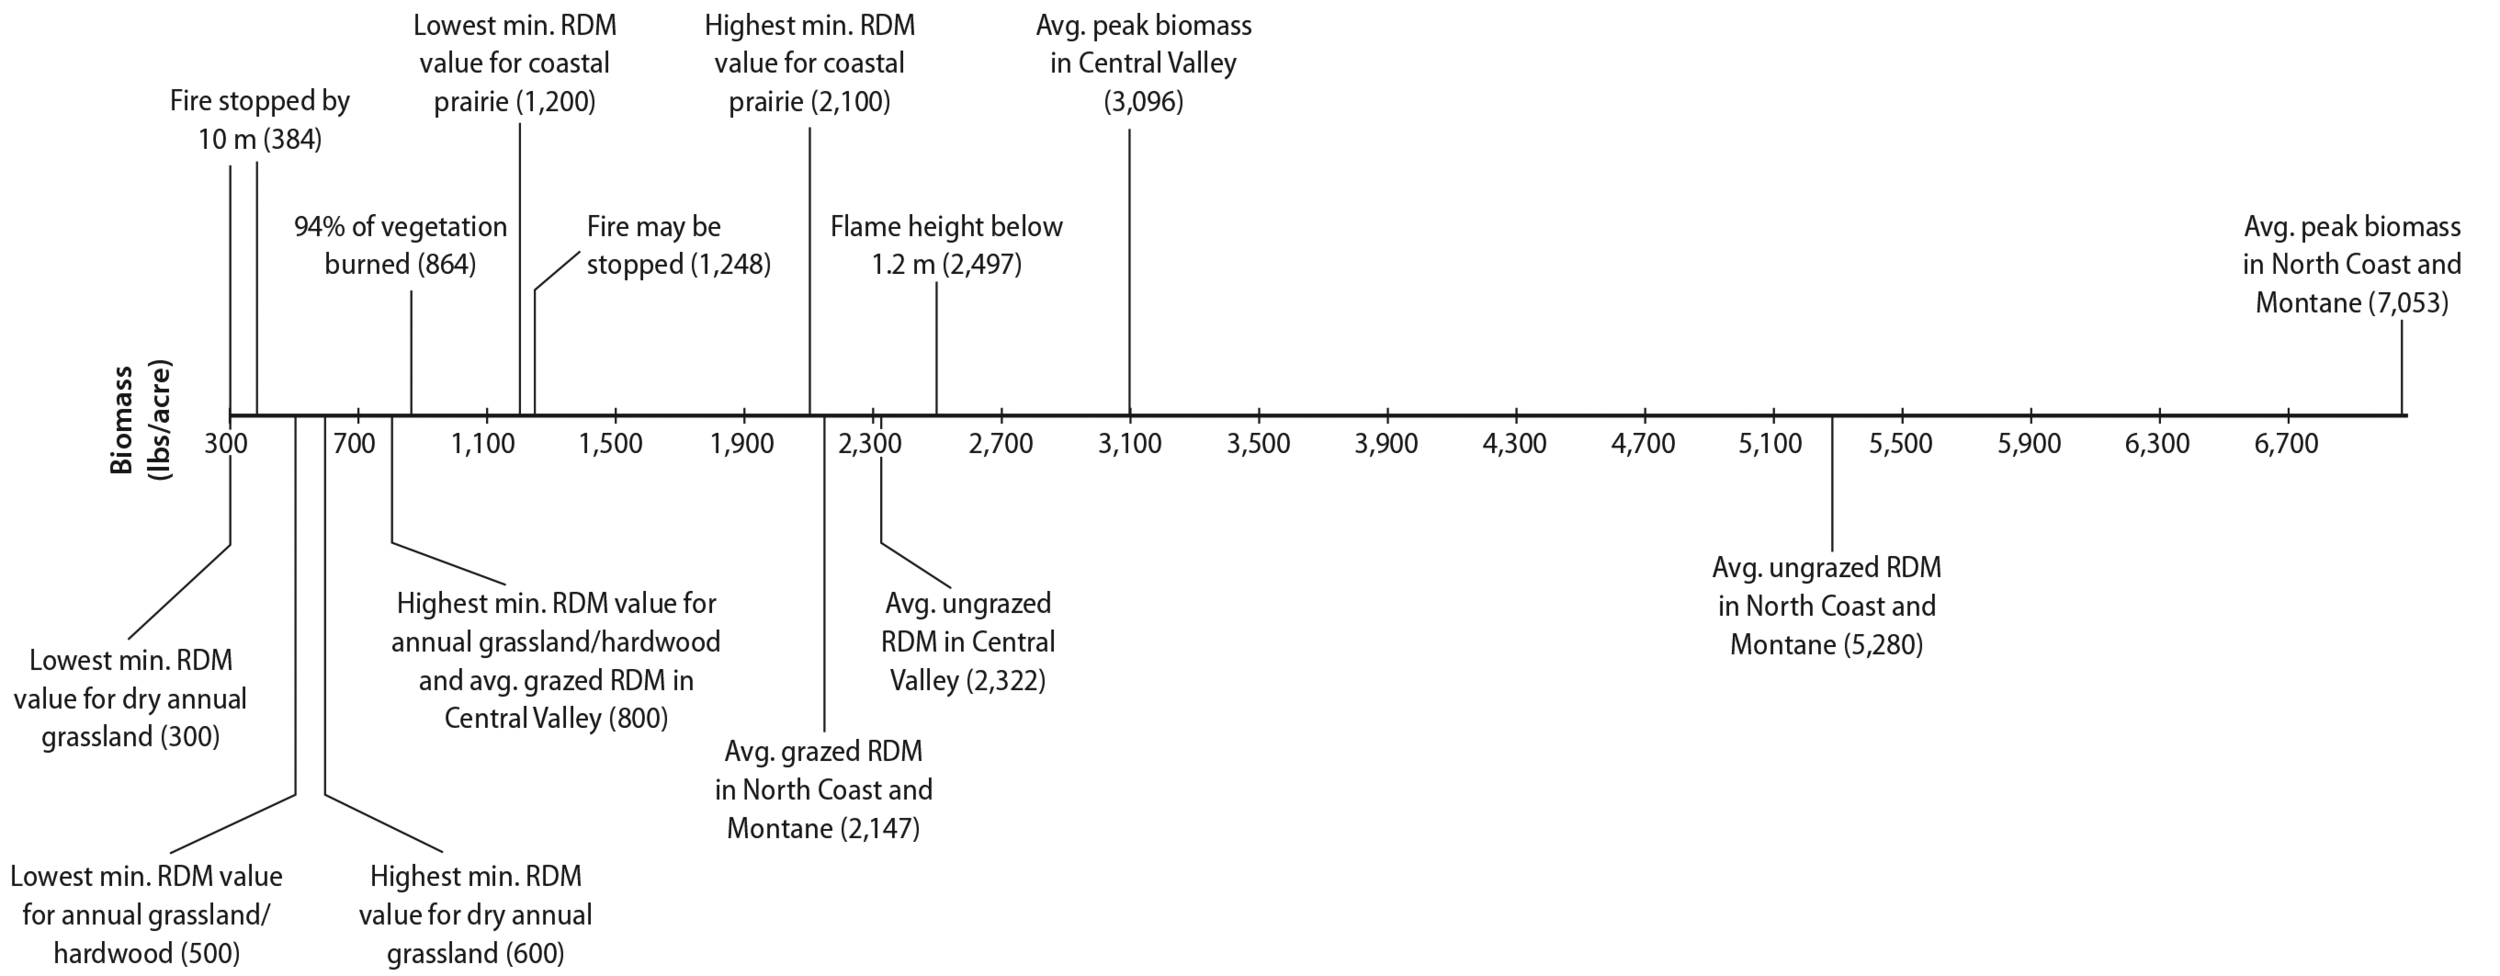
Nearly one-fifth of California’s land mass is currently grazed (Ratcliff et al. 2022, 64). Livestock and livestock producers represent a critical resource to help address landscape-level wildfire hazards in the state. Until now, it was not well understood how specific grazing intensities affect fire behavior metrics. The thresholds described in table 3 and placed in a regional biomass context within figure 5 provide land managers and livestock operators with multiple biomass targets that can be utilized in planning for fire protection balanced with ecological concerns. These fire-related thresholds can be compared to regional herbaceous biomass production and minimum residual dry matter (RDM) standards (fig. 5) (Bartolome et al. 2006, 2; Ratcliff et al. 2022, 65). In the highly productive coastal rangelands, higher levels of biomass are produced and maintained for optimum ecological health while interior regions of California produce lower amounts of biomass and may be grazed to lower levels. The minimum RDM standards vary by grassland type, slope, and woody cover, where lower productivity grassland types have a lower minimum RDM standard and vice versa. Meeting the minimum RDM standard improves soil health and germination of desirable species (Bartolome et al. 2006, 1).

Table 3.Interpretation and implication of grassland biomass thresholds related to fire behavior metrics derived from decision trees for prescribed burns across California (2020 to 2022). Values are rounded to the nearest whole number for lb/acre and g/m2.
Threshold (lb/acre [g/m2]) Interpretation Implications for management
2,496 lb/acre (280 g/m2) Only 3% of treatments with fewer than 2,496 lb/acre of herbaceous biomass had flame heights exceeding 4 ft (1.2 m). This level of biomass allows hand crews to fight fire and coincides with light to no grazing levels, depending on the region. This level is above all California minimum fall biomass standards outlined for ecological benefits by Bartolome et al. (2006). This value is above the ungrazed and grazed biomass values in the Central Valley as well as the average grazed fall biomass value in the North Coast and Montane region (Ratcliff et al. 2022).
1,248 lb/acre (140 g/m2) None of the treatments with greater than 1,248 lb/acre of herbaceous biomass stopped a fire prior to reaching 33 ft (10 m). There is a 34% probability that a fire will stop spreading with biomass levels at or below this threshold but 0% probability a fire will be stopped above the threshold. This value is above the minimum fall biomass standard values for all annual grassland and annual grassland-hardwood types, which range from 300 to 800 lb/acre (Bartolome et al. 2006, 2). This value is also above the average grazed fall biomass value for the Central Valley (Ratcliff et al. 2022).
384 lb/acre (43 g/m2) 93% of treatments with herbaceous biomass below 384 lb/acre stopped a fire before reaching 33 ft (10 m). Fire will not carry below this threshold during most prescribed fire weather conditions. This level is below most recommended fall biomass values for ecological maintenance. Obtaining this biomass level likely compromises other management goals for both land and livestock.
Horizontal chart in a timeline format showing biomass (lb/acre) from about 200 to 7,000, with labeled thresholds for fire behavior and vegetation (RDM). Lower biomass (~200--600 lb/acre) represents minimum RDM levels for different grassland types. Around 384 lb/acre, fire is likely to stop within 10 m. At 864 lb/acre, about 94% of vegetation burns. Above 1,248 lb/acre, fire is less likely to stop quickly. Around 2,100--2,500 lb/acre, flame height is below 4 ft (1.2 m). Higher values (~3,000--7,000 lb/acre) represent average and peak biomass in Central Valley and North Coast/Montane regions.
Fig. 5.Average herbaceous biomass production and recommended fall biomass or residual dry matter (RDM) amounts (lb/acre) for grazed and ungrazed California vegetation zones as well as herbaceous biomass (lb/acre) thresholds related to fire behavior metrics observed at prescribed burn study sites across California (2020 to 2022). Minimum RDM values are from Bartolome et al. 2006. Average peak biomass and grazed and ungrazed RDM are from Ratcliff et al. 2022. North Coast is from Northern California Coastal (Point Reyes) data cited in Ratcliff et al. 2022.

Critical upper biomass thresholds

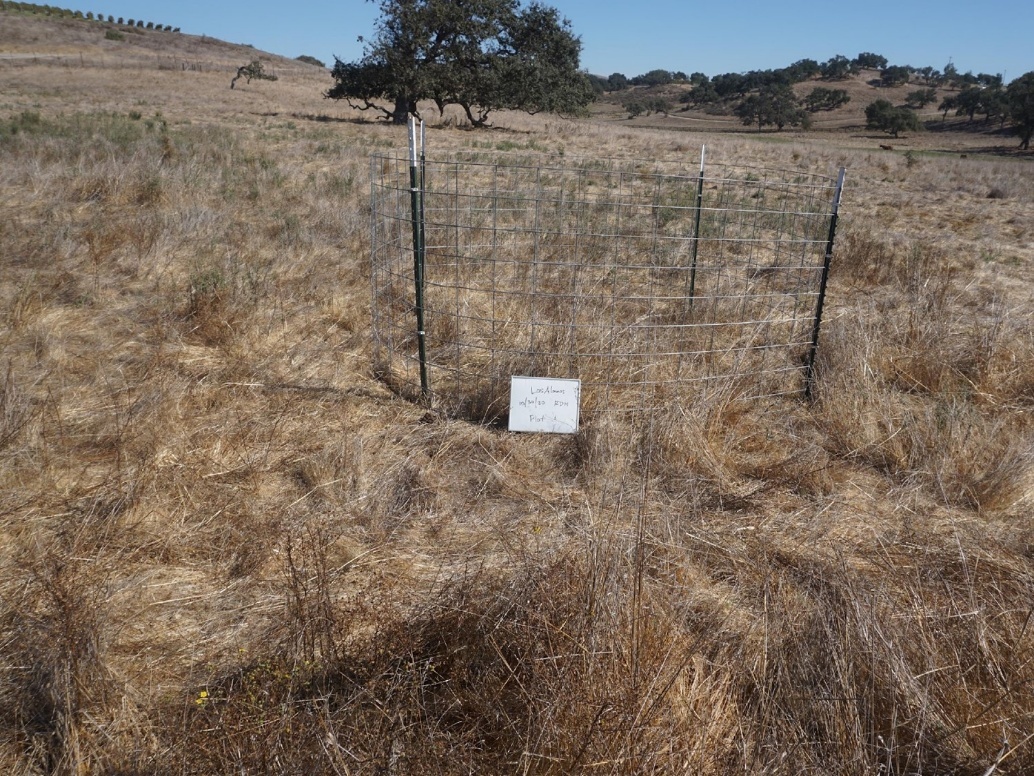
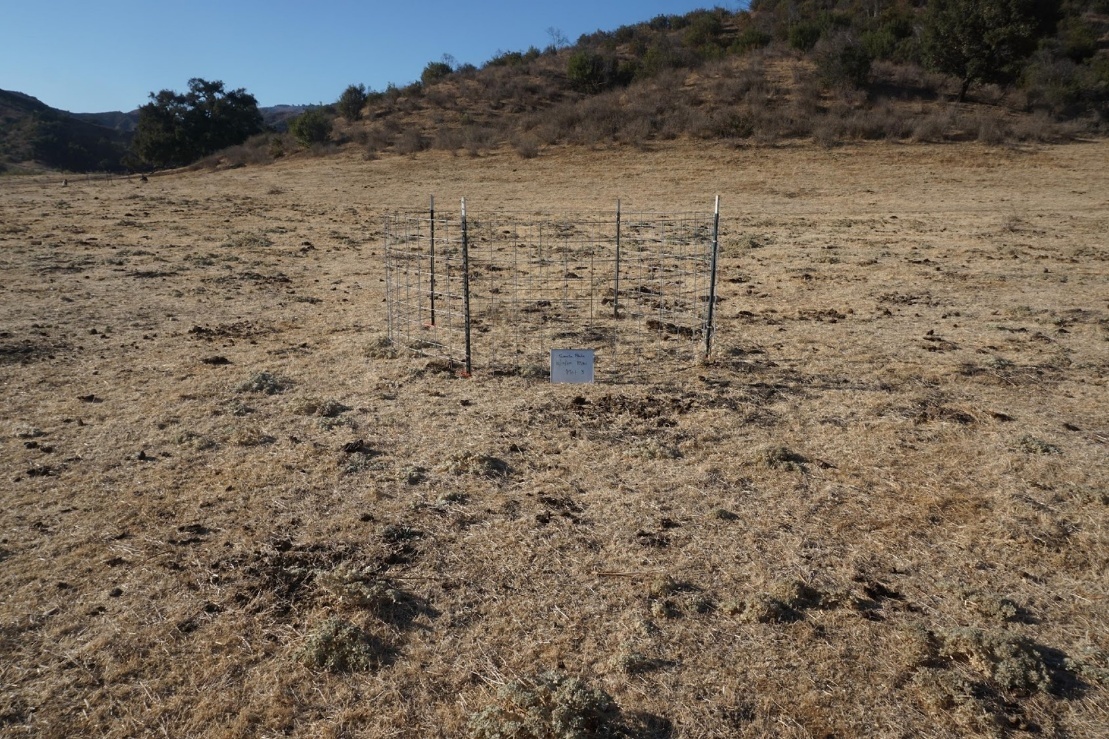
By grazing herbaceous biomass levels below 2,496 lb/acre (280 g/m2), the likelihood of flames exceeding 4 ft (1.2 m) is greatly diminished. Figures 6 and 7 show grasslands with biomass above and below this threshold. This biomass level generally coincides with modest grazing levels on coastal prairie and Coast Range grasslands, and a single-year rested pasture in the Central Valley (Bartolome 1987, 122; Becchetti et al. 2016; Larsen et al. 2020). These data suggest that even light levels of grazing can provide safer conditions for firefighters. On rural rangelands, the ability of local personnel to conduct initial fire containment rapidly diminishes when flame heights exceed 4 ft because hand crews can no longer directly attack the fire (Andrews et al. 2011, 1).

View of a hill with dried, tan-colored grassland and oaks in the background. At the center of the photo, there are long stalks of grass and wire fencing surrounds the treatment area.
Fig. 6.Example field in Santa Barbara County (California) with 3,140 lb/acre of herbaceous biomass (over 2,496 lb/acre threshold) representing ungrazed or very lightly grazed biomass where flame heights can exceed 4 ft. Photo: M. Shapero.
View of grassland with shorter grass.
Fig. 7.Example field in Contra Costa County (California) with 1,918 lb/acre of herbaceous biomass (within 1,250 and 2,496 lb/acre range), representing light to moderately grazed biomass where flame heights are below 4 ft and fire will not be stopped. Photo: R. Foss.

Reducing biomass below 1,248 lb/acre (140 g/m2) represents an important reduction in fire movement across a grassland: there is a chance that fire may not carry below this biomass level. Figure 8 shows a grassland with biomass below this threshold.

View of grassland with a hill in the background. There is wire fencing surrounding the treatment area at the center of the photo.
Fig. 8.Example field in Ventura County (California) with 1,160 lb/acre of herbaceous biomass (within 1,250 and 384 lb/acre range), representing moderate to heavily grazed biomass where flame heights are below 4 ft and fire may be stopped. Photo: M. Shapero.

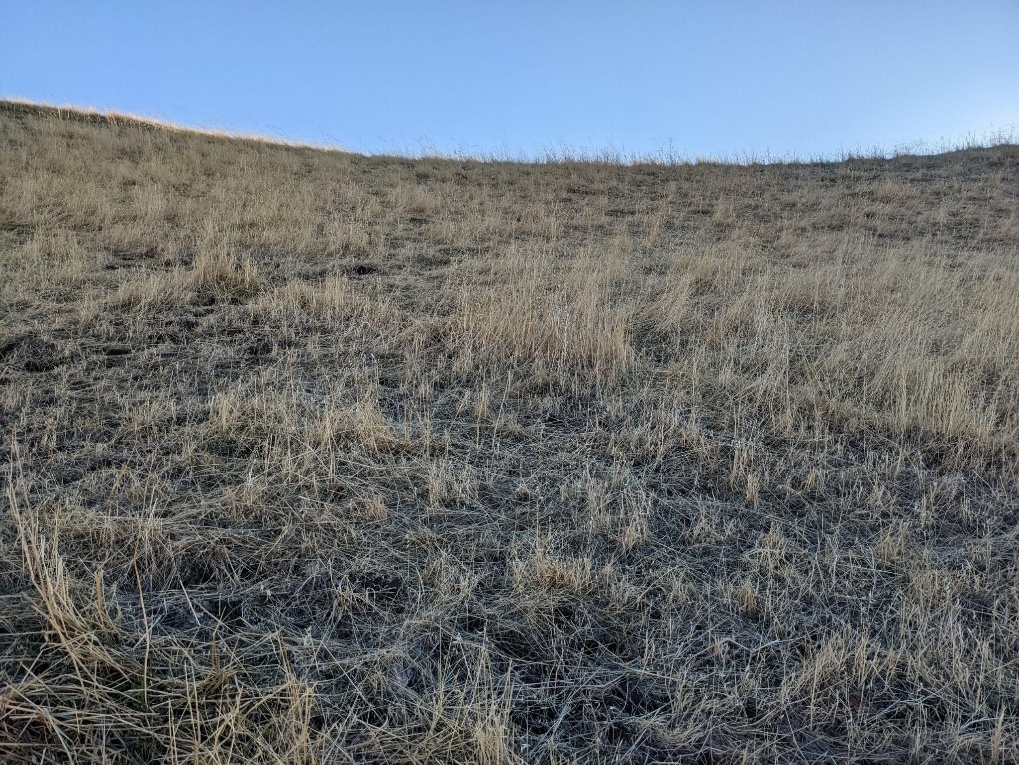
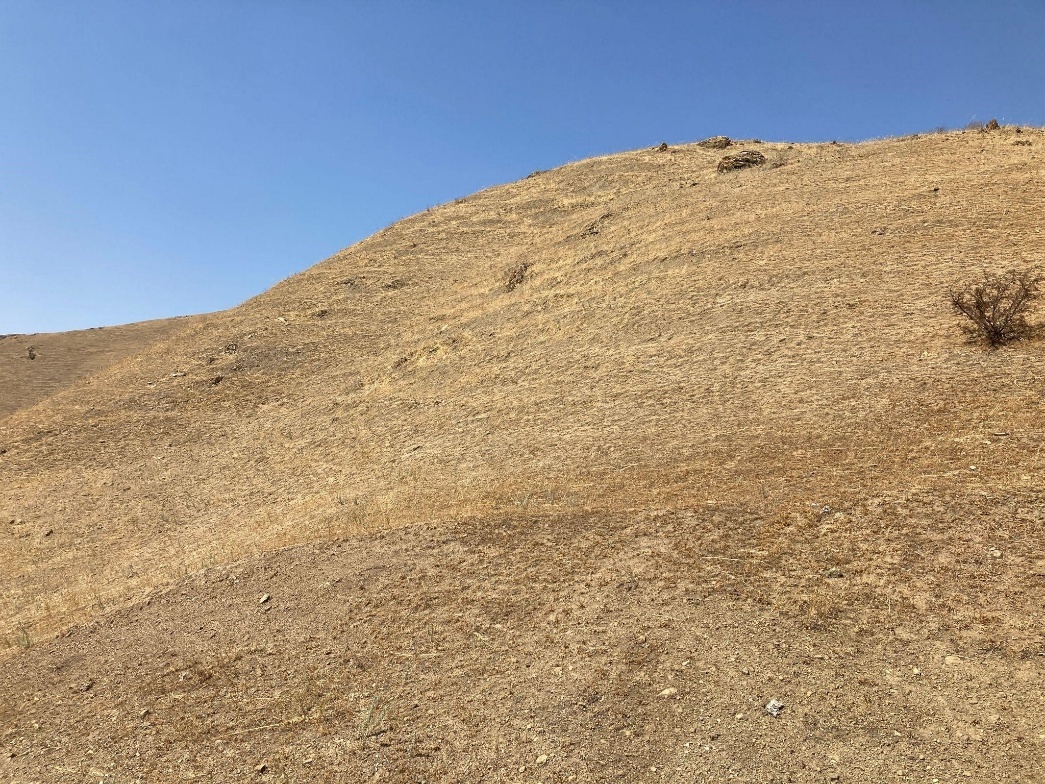
The lowest of the thresholds, approximately 384 lb/acre (43 g/m2), represents the most extreme of the mimicked grazing ranges. Figure 9 shows a grassland with biomass below this level. This value may be used for contract grazing where the primary goal is maintaining fire lines adjacent to physical assets or residences, or for fire protection along potential ignition sources (e.g., roads, utilities). However, managing vegetation to this threshold may increase impacts to soil and vegetation health and structure in nearly all grassland types (Bartolome et al. 2006, 1), reduce animal health and performance, and impact visual aesthetics.

A hill that has been heavily grazed.
Fig. 9.Example field in San Joaquin County (California) with 315 lb/acre of herbaceous biomass (below 384 lb/acre threshold), representing very heavily grazed biomass where fire will be stopped. Photo: R. Foss.

Managing for biomass below 1,248 lb/acre and above 384 lb/acre (as shown in figure 8) aligns with achieving some fire hazard reduction while meeting most of the minimum RDM standards and biological goals in the AGH (Bartolome and Betts 2005). However, this range may compromise sensitive ecological resources in coastal prairie, which has higher minimum RDM standards.

Implications for management

It is important to note that our study was conducted during prescribed burns, which are typically limited to milder weather conditions. It is expected that flame heights, rate of spread, and other parameters would intensify in more extreme weather conditions. With this consideration, managers may desire lower herbaceous biomass targets for grasslands with higher wildfire hazard concerns. Future research is needed in a wildfire setting to better understand the nuances of wildfire interactions with biomass, but these data offer initial insight into the relationship between grazing levels and fire behavior.

Significant relationships between herbaceous biomass and multiple key fire behavior metrics indicate that grassland management, which often consists of grazing, alters on-the-ground fire behavior. Grassland fire metrics that were significantly altered by mimicking grazing levels included flame height, fire stopping within 33 ft (10 m), total area burned, surface temperature, and white ash cover. Specific thresholds at 384, 1,248, and 2,496 lb/acre were identified through the decision tree approach and may be used by land managers to achieve site goals.

The lowest of the biomass thresholds may apply to fire lines or “fire fields” adjacent to critical infrastructure, or along potential ignition sources, while other areas may be managed to the intermediate thresholds where fire risk is lower. Rangelands may also be managed to create a strategic patchwork effect where more heavily grazed pastures are distributed throughout a larger operation to create fire-safe islands where livestock or crews may reside during wildfires. Managers may utilize these thresholds to increase ecosystem fire resiliency by working with natural landscape heterogeneity to increase the patchiness of fire intensity and reduce the total area burned. The thresholds reported from these results are intended to help inform a more comprehensive planning process that weighs the specific goals for different areas.


Acknowledgments

The authors would like to thank our funders: the Russell L. Rustici Rangeland and Cattle Research Endowment awarded through the College of Agricultural and Environmental Sciences, University of California, Davis, and Vollmar Natural Lands Consulting.

The authors would also like to acknowledge J. Restaino for providing introductions to CalFire burn coordinators; J. Childress, the Audubon Canyon Ranch Fire Forward program, and B. Mattos of CalFire Madera-Mariposa-Merced Unit for inviting the study onto multiple burns; UC Santa Barbara Sedgwick Reserve staff for conducting field work and collecting data at the Reserve burn; Prof. F. Davis of UC Santa Barbara for insights to the study design; M. Valdes-Berriz, H. Hwang, K. Chinn, G. Ferrari, A. Tan, as well as other UC ANR and VNLC staff that conducted field work and assisted in data entry. We would also like to acknowledge the landowners that allowed the research to occur on their properties and CalFire staff for their support in burning the research plots.

Submitted: June 25, 2025 PDT

Accepted: March 23, 2026 PDT

References

Andrews, P. L., F. A. Heinsch, and L. Schelvan. 2011. How to Generate and Interpret Fire Characteristics Charts for Surface and Crown Fire Behavior. RMRSGTR-253. U.S. Department of Agriculture, Forest Service. https:/​/​doi.org/​10.2737/​RMRS-GTR-253.
Barbour, M. G., T. Keeler-Wolf, and A. A. Schoenherr, eds. 2007. Terrestrial Vegetation of California. 3rd ed. University of California Press. https:/​/​www.jstor.org/​stable/​10.1525/​j.ctt1pnqfd.
Google Scholar
Bartolome, J. W. 1987. “California Annual Grassland and Oak Savannah.” Rangelands 9 (3): 122–25. http:/​/​hdl.handle.net/​10150/​640219.
Google Scholar
Bartolome, J. W., and A. D. K. Betts. 2005. “Residual Dry Matter Impacts on Water Quality and Biomass Production.” Proceedings of the University of California Sierra Foothill Research and Extension Center Field Day, April 21.
Google Scholar
Bartolome, J. W., W. Frost, and N. McDougald. 2006. Guidelines for Residual Dry Matter (RDM) Management. UC Agriculture and Natural Resources Publication 8092. https:/​/​doi.org/​10.3733/​ucanr.8092.
Becchetti, T., M. George, N. McDougald, et al. 2016. Rangeland Management Series: Annual Range Forage Production. UC Agriculture and Natural Resources Publication 8018. https:/​/​doi.org/​10.3733/​ucanr.8018.
Bruegger, R. A., L. A. Varelas, L. D. Howery, et al. 2016. “Targeted Grazing in Southern Arizona: Using Cattle to Reduce Fine Fuel Loads.” Rangel Ecol Manag 69 (1): 43–51. https:/​/​doi.org/​10.1016/​j.rama.2015.10.011.
Google Scholar
Caratti, J. F. et al. 2006. “Point Intercept (PO).” In FIREMON: Fire Effects Monitoring and Inventory System, edited by D. C. Lutes, R. E. Keane, J. F. Caratti, et al. Gen. Tech. Rep. RMRS-GTR-164-CD. U.S. Department of Agriculture, Forest Service, Rocky Mountain Research Station. https:/​/​doi.org/​10.2737/​RMRS-GTR-164.
Google Scholar
Davies, K. W., J. D. Bates, T. I. Svejcar, and C. S. Boyd. 2010. “Effects of Long-Term Livestock Grazing on Fuel Characteristics in Rangelands: An Example from the Sagebrush Steppe.” Rangel Ecol Manag 63 (6): 662–69. https:/​/​doi.org/​10.2111/​REM-D-10-00006.1.
Google Scholar
Davies, K. W., C. S. Boyd, J. D. Bates, and A. Hulet. 2015. “Dormant-Season Grazing May Decrease Wildfire Probability by Increasing Fuel Moisture and Reducing Fuel Amount and Continuity.” Int J Wildland Fire 24 (6): 849–56. https:/​/​doi.org/​10.1071/​WF14209.
Google Scholar
Diamond, J. M., C. A. Call, and N. Devoe. 2009. “Effects of Targeted Cattle Grazing on Fire Behavior of Cheatgrass-Dominated Rangeland in the Northern Great Basin, USA.” Int J Wildland Fire 18 (8): 944–50. https:/​/​doi.org/​10.1071/​WF08075.
Google Scholar
[EBRPD] East Bay Regional Park District. 2013. East Bay Regional Park District Master Plan 2013. Resolution no. 2013-07-159. http:/​/​www.ebparks.org/​sites/​default/​files/​MasterPlan2013.pdf.
Iverson, L. R., D. A. Yaussy, J. Rebbeck, et al. 2004. “A Comparison of Thermocouples and Temperature Paints to Monitor Spatial and Temporal Characteristics of Landscape-Scale Prescribed Fires.” Int J Wildland Fire 13 (3): 311–22. https:/​/​doi.org/​10.1071/​WF03063.
Google Scholar
Larsen, R., M. Shapero, M. Horny, et al. 2020. Forage Production Report: California Central Coast 2001-2019. University of California Agriculture and Natural Resources. http:/​/​www.us-ltrcd.org/​files/​1a8c68bc0/​forage+production+central+coast+2001-2019.pdf.
Orr, D. A., J. D. Bates, and K. W. Davies. 2022. “Grazing Intensity Effects on Fire Ignition Risk and Spread in Sagebrush Steppe.” Rangel Ecol Manag 89 (1): 51–60. https:/​/​doi.org/​10.1016/​j.rama.2022.08.004.
Google Scholar
R Development Core Team. 2008. R: A Language and Environment for Statistical Computing. Foundation for Statistical Computing. http:/​/​www.r-project.org.
Google Scholar
Ratcliff, F., D.R. Rao, S.J. Barry, et al. 2022. “Cattle Grazing Reduces Fuel and Leads to More Manageable Fire Behavior.” Calif Agr 76 (2): 60–69. https:/​/​doi.org/​10.3733/​ca.2022a0011.
Google Scholar
Schmelzer, L., B. Perryman, B. Bruce, et al. 2014. “Reducing Cheatgrass (Bromus Tectorum L.) Fuel Loads Using Fall Cattle Grazing.” Prof Anim Sci 30 (2): 270–78. https:/​/​doi.org/​10.15232/​S1080-7446(15)30112-1.
Google Scholar
Siegel, K. J., L. Macaulay, M. Shapero, et al. 2022. “Impacts of Livestock Grazing on the Probability of Burning in Wildfires Vary by Region and Vegetation Type in California.” J Environ Manag 322 (15): 116092. https:/​/​doi.org/​10.1016/​j.jenvman.2022.116092.
Google Scholar
Stechman, J. V. 1983. “Fire Hazard Reduction Practices for Annual-Type Grassland.” Rangelands 5 (2): 56–58. http:/​/​hdl.handle.net/​10150/​638425.
Google Scholar
Steel, Z. L., H. D. Safford, and J. H. Viers. 2015. “The Fire Frequency-Severity Relationship and the Legacy of Fire Suppression in California Forests.” Ecosphere 6 (1): 1–23. https:/​/​doi.org/​10.1890/​ES14-00224.1.
Google Scholar
Stephens, S. L., R. E. Martin, and N. E. Clinton. 2007. “Prehistoric Fire Area and Emissions from California’s Forests, Woodlands, Shrublands, and Grasslands.” For Ecol Manag 251 (3): 205–16. https:/​/​doi.org/​10.1016/​j.foreco.2007.06.005.
Google Scholar
Stephens, S. L., and L. W. Ruth. 2005. “Federal Forest-Fire Policy in the United States.” Ecol Appl 15 (2): 532–42. https:/​/​doi.org/​10.1890/​04-0545.
Google Scholar
Stephens, S. L., D. R. Weise, D. L. Fry, et al. 2008. “Measuring the Rate of Spread of Chaparral Prescribed Fires in Northern California.” Fire Ecol 4 (June): 74–86. https:/​/​doi.org/​10.4996/​fireecology.0401074.
Google Scholar
Taylor, C. A. 2006. “Targeted Grazing to Manage Fire Risk.” In Targeted Grazing: A Natural Approach to Vegetation Management and Landscape Enhancement, edited by K. Launchbaugh and J. W. Walker. American Sheep Industry Association. http:/​/​www.lib.uidaho.edu/​digital/​rangecoll/​items/​rangecoll59.html.
Google Scholar
[USDA] United States Department of Agriculture Forest Service. 2011. “CALVEG Tiles Ecoregions.” In FSGeodata Clearinghouse Enterprise Data. https:/​/​data.fs.usda.gov/​geodata/​edw/​datasets.php.

Attachments

Powered by Scholastica, the modern academic journal management system