
For shoppers, purchasing at farmers markets is associated with more fruit and vegetable intake (Hu et al. 2021; Jilcott Pitts et al. 2015; Kelley et al. 2022). Farmers markets may offer more nutritionally dense food: the nutritional quality of refrigerated produce declines over time postharvest (Li et al. 2017), whereas farmers market vendors often sell produce harvested within several days (Thomson et al. 2021). In some cases, farmers markets may be a more affordable choice for shoppers: several studies have shown evidence that certain fruits and vegetables sold at farmers markets, especially those produced organically, are similarly priced or less expensive than produce at supermarkets (Hewawitharana et al. 2022; Martinez 2015; Warnert 2014), though others have found that prices are higher at markets (Valpiani et al. 2015). Greenwald et al. (2022) found that 42% of farmers market shoppers in Southern and Central California who used CalFresh (the program name for the Supplemental Nutrition Assistance Program, or SNAP, in California) and Market Match reported that the farmers market prices were about the same as other food outlets. Finally, shoppers using food assistance benefits may benefit from buying at farmers markets that offer incentive programs such as Market Match, which provide matching funds to increase purchasing power for shoppers: several studies have found that incentive programs influence shoppers’ decisions to purchase from farmers markets (Gosliner et al. 2022; Greenwald et al. 2022).
For direct-marketing farmers, food assistance benefits represent an underdeveloped economic opportunity. Nationally, SNAP redemptions at farmers markets make up 0.03% of all redemptions (USDA 2025). For the regional economy, increasing the income of direct-marketing farmers has widespread benefits. With every dollar earned by a direct-marketing farmer in the Sacramento region, twice as much economic activity is generated in the region compared to non-direct marketing farmers (Hardesty et al. 2016).
Despite these benefits, studies have found consistent barriers to farmers markets’ and vendors’ acceptance of assistance benefits, including the cost of bookkeeping, complications with reimbursement, a perceived lack of customers, a perceived lack of economic return, lack of information about the application, lack of internet connection, equipment issues and more (Kellegrew et al. 2018; Roubal et al. 2016; Russomanno and Jabson 2016; Saitone and McLaughlin 2018). Studies have also found that certain market characteristics are associated with SNAP acceptance including larger size, membership in a market association, a strong digital presence, a board of directors, and a mission statement (Dixit-Joshi et al. 2013; Hasin et al. 2014; Hasin and Smith 2018).
Several studies examine the regulations, policies and governance of farmers markets (Betz and Farmer 2016; Hoffman et al. 2009; Manser 2022), but few address ownership type as a variable of measurement. One exception is Gantla and Lev (2015), who inductively identified three ownership categories among Oregon farmers markets: independent vendor-led markets, independent community-led markets, and “sub-entity” markets that operate under the governance of another organization. Each ownership type was associated with strengths and challenges around “market management, mission, and prioritizing of market goals” (p. 54).
We could not identify prior literature that took a regional approach to examining barriers and facilitators around food assistance acceptance at farmers markets, nor could we identify established methods for systematically determining the regional availability of various types of food assistance programming. Our effort offers a novel approach in surveying managers about a range of possible food assistance programs at markets and contributes a new methodology for regional scans.
This study’s first research objective is to examine the availability of food assistance programs — specifically CalFresh, Special Supplemental Nutrition Assistance Program for Women, Infants and Children (WIC)/Senior Farmers Market Nutrition Program (FMNP) and nutrition incentives — at certified farmers markets in the Sacramento region. Included in this examination is how markets fund activities related to the programs, and whether or not market characteristics are related to program availability. The second objective is to investigate how market managers perceive challenges and benefits around participating in food assistance programs. This research serves an extension effort to increase the use of food assistance programs at markets in the Sacramento region. Preceding this work, we could not locate data about program availability in the region, making it difficult to set goals and measure progress in the context of improving food access.
Methods
Participants
We limited the sample to certified markets — those that have been certified by their county’s agricultural commissioner — because several of the food assistance programs we investigated are only valid at certified markets. We chose to look at markets in eight counties that were either part of the Sacramento Area Council of Governments or the Sacramento-Roseville combined statistical area designated by the U.S. Office of Management and Budget: Butte, El Dorado, Nevada, Placer, Sacramento, Solano, Sutter and Yolo counties. We reached out to each county’s agricultural department to request the names of certified markets that operated in their county at any time in 2023, as well as the names of the market managers and their contact information. The role of a market manager is distinct in California’s regulatory system, being the person who commits to ensuring compliance with the California Certified Farmers’ Market Program. While only some certified markets have administrative staff, all certified markets have a designated manager who typically supervises market operations and is knowledgeable of food assistance programming at their markets. We excluded markets that were limited-time events such as fairs and festivals. We cross-referenced each county-provided list with the list of certified markets that the California Department of Food and Agriculture maintains online and reconciled differences. Seventy-two markets met our eligibility criteria. This study was classified as not human subjects research by the UC Davis Institutional Review Board in November 2023 (Protocol #2129182).
Quantitative survey
We developed survey questions about program availability and the challenges and benefits associated with each program. The questions were based on various sources, including the USDA Market Manager Survey (USDA 2020), Dixit-Joshi (2013) and Hasin and Smith (2016), to support comparability with results from other regions. We piloted the survey with five key interviewees, including market managers, academics and agency experts, to ensure the survey’s accuracy and relevance. Based on the key interviewees’ feedback, some questions were edited for clarity or were deleted because the regulations informing them had changed. The final survey was comprised of 58 items, covering market characteristics, administration of the market, CalFresh participation, WIC/Senior FMNP participation, and nutrition incentive participation (see online technical appendix). In addition to asking about participation in each program, respondents were asked about their agreement (5-point Likert scale) to statements about benefits and challenges associated with the programs. For each statement the respondent agreed to, they were asked to rank its importance relative to all other statements they agreed to with 1 reflecting the highest importance among statements.
We used the Qualtrics online platform to deliver the survey over the phone between March and July of 2024. Some data was pre-entered based on available online information, such as market dates and times, and verbally reviewed during the survey delivery. Managers of multiple markets were asked to complete a survey for each individual market, given that food assistance programming was sometimes different between markets operated by the same entity. Each survey took about 15 to 45 minutes to complete depending on the programs the market participated in. We made three attempts to contact each manager by phone. In one case where the manager deferred their responses to their market’s office administrator, the administrator’s response was accepted. We offered $25 Visa gift cards for each market survey completed. We collected survey responses for 59 markets, representing 82% of all markets that met inclusion criteria. Of the 13 markets that did not respond to the survey, we could not identify common characteristics; without talking with the managers, we did not have data about market characteristics such as size or legal entity type.
Qualitative interviews
We developed a qualitative guide to interview market managers to expand on their survey responses around the challenges and benefits of accepting CalFresh, the largest food assistance program at farmers markets. Our aim was to understand managers’ perceptions of challenges and benefits in more depth with the hope of elucidating where Cooperative Extension efforts may be capable of providing support. We created a purposive subsample based on a series of steps.
First, we exported the survey results and looked at four factors: CalFresh acceptance, the average number of vendors at peak season, membership in a larger market association, and whether the organization reported to a board. Next, we used these four factors to define 16 categories based on all possible combinations. Each market was sorted into the corresponding category and assigned a unique number. We used a randomizer to pick one market using its unique number from each code category. If the randomizer picked markets managed by the same manager, we used the randomizer to pick again.
This process yielded a list of 14 markets representing diverse sizes, operator types and experiences with food assistance programs; two of the 16 possible categories were not represented by any markets. We contacted the managers of those markets by phone or mail at least three times and offered them a $100 gift card for participating in a roughly 30-minute interview. We conducted nine interviews in July of 2024 from this purposive sample of market managers. Of the five markets that did not respond to the invitation to participate in interviews, there was no stand-out market characteristic that distinguished them, other than that all of the non-responsive managers operated multiple markets.
Analysis
We descriptively analyzed quantitative data using means and standard deviations for continuous variables and calculated counts and percentages for categorical variables. We used a basic deductive content analysis approach to analyze the transcribed qualitative interviews (Hsieh and Shannon 2005). We drafted an initial codebook to align with the study objectives, with codes based on relevant published literature and quantitative questionnaire items. Three of our research team members used the initial codebook draft to independently code one interview transcript. They then compared and discussed their coding to inform points of clarification needed to finalize the codebook. Two of our researchers then used the final codebook to each independently code every transcript. The codes applied were compared and discussed in teams of two, and any discrepancies were resolved via discussion and input from a third team member, as needed. We assessed the final set of coded transcripts for patterns of occurrence and co-occurrence. We then used mixed methods and integrated the results of the quantitative and qualitative analyses via comparison and data-informed categorization to facilitate cross-case pattern recognition and derive meta-inferences (Creswell and Plano Clark 2018).
Results
Descriptive quantitative analyses among the 59 participating markets (table 1) provided a variety of insights, broadly organized below into findings regarding the participation in programs, how programming participation was supported, specific benefits and challenges of participating in CalFresh, and the challenges and benefits associated with participating in WIC/Senior FMNP. Qualitative data are integrated into the section on CalFresh participation challenges and used to support a nuanced mixed methods understanding. Each section begins with the corresponding primary finding as a sub-heading. The first two sections respond to Research Objective 1 (to examine the availability of food assistance programs, how programs are supported, and how market characteristics relate to program availability) and the remaining sections respond to Research Objective 2 (to investigate how market managers perceive challenges and benefits around participating in food assistance programs).
Ability to use food assistance benefits at farmers markets differs both by specific program and market characteristics
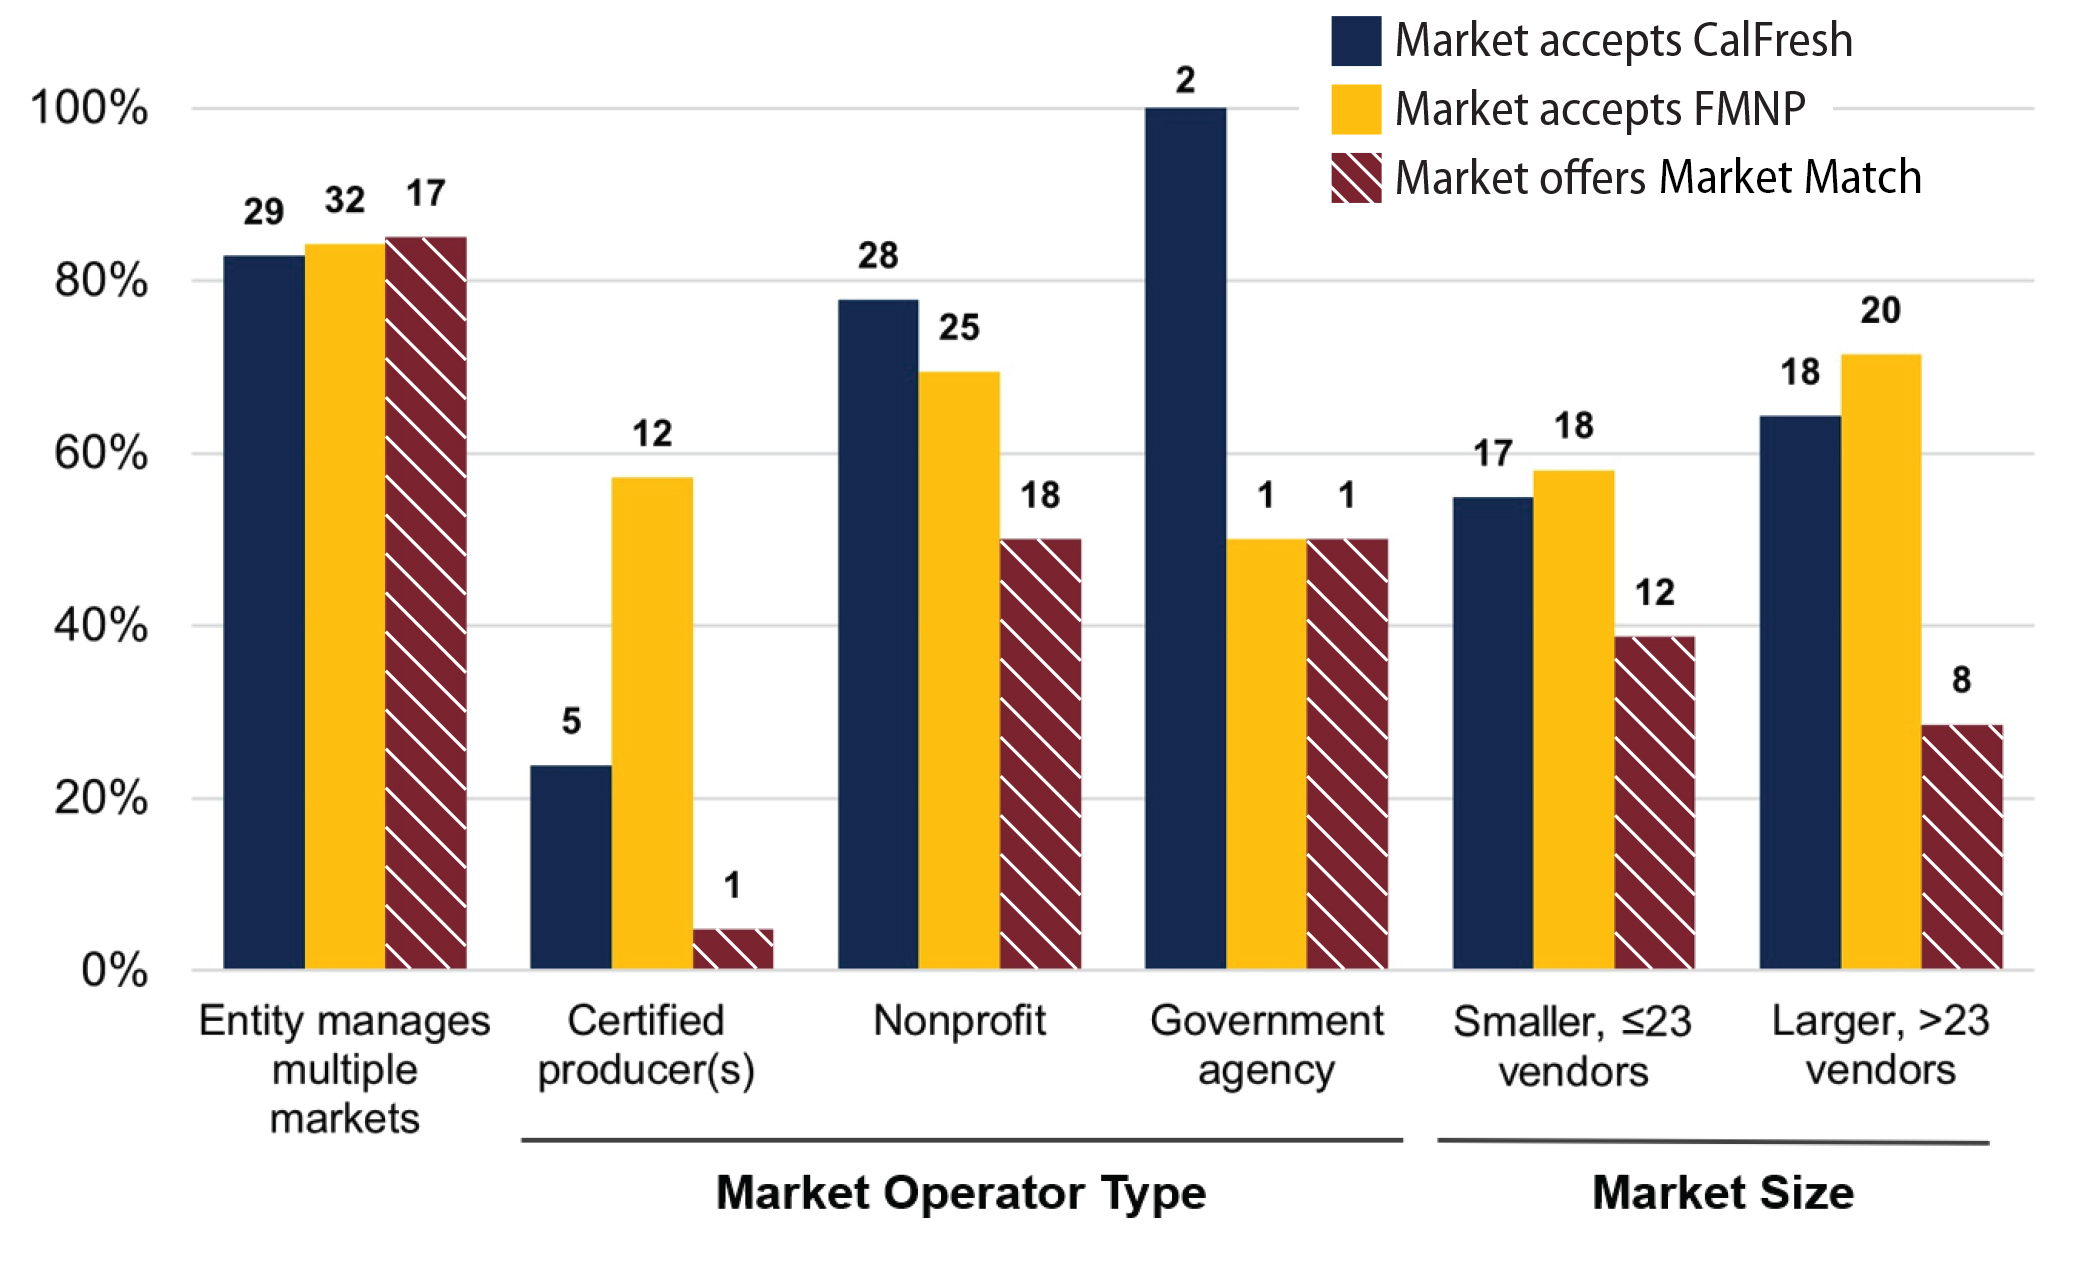
In response to Research Objective 1, table 2 describes program availability in the sample overall and figure 1 illustrates the variation of program availability by key market characteristics. Fifty-nine percent of farmers markets surveyed accepted CalFresh and 64% accepted WIC/Senior FMNP, while 34% participated in Market Match and 14% participated in another kind of incentive program. Most of the other incentive programs were referencing California Nutrition Incentive Program (CNIP)-funded matches of FMNP benefits. Markets offering Market Match were more frequently operated by nonprofits and smaller markets (i.e., ≤ 23 vendors). Markets operated by certified producers were more frequently markets that accepted FMNP.
_by_participation_in_food_assistance_program.jpg)
Nonprofits operating markets were the most likely to offer all three programs, far exceeding the proportion of farmers markets run by certified producers or government agencies that accepted or offered food assistance programs. People or organizations that manage multiple markets were also slightly more likely than those operating single markets to accept CalFresh and FMNP, and to offer Market Match. Eighteen markets — about 30% of all surveyed markets — accepted CalFresh, FMNP and Market Match. Eleven markets — about 19% of all surveyed markets — accepted both CalFresh and FMNP but did not offer Market Match.
Half of markets relied on some external funding to support their CalFresh acceptance
Table 3 shows the sources of support to pay for various aspects of CalFresh acceptance at participating markets. Among markets that accepted CalFresh, 46% reported they self-funded their CalFresh acceptance, meaning that the market or its sponsor paid for staffing, administration and materials. The other 54% of CalFresh-accepting markets used external support to some extent, with 27% of markets exclusively relying on external support. Markets named three partner organizations that supported their CalFresh acceptance — Ecology Center, CSU Chico Center for Healthy Communities and Alchemist CDC — as well as several external market sponsorships that financially supported CalFresh acceptance.
Accepting CalFresh at farmers markets resulted in numerous perceived benefits
Our study’s second research objective was to investigate how market managers perceived challenges and benefits around participating in food assistance programs (table 4). Over 90% of markets felt that by accepting CalFresh benefits they were: increasing sales for producers, increasing different types of customers, promoting access to healthy food in the community, responding to vendor interest, responding to customer interest, and improving the market’s public image. Eighty percent of markets also felt accepting CalFresh benefits supported the local economy.
Perceived challenges of accepting CalFresh differed by whether the markets were actively participating in the program
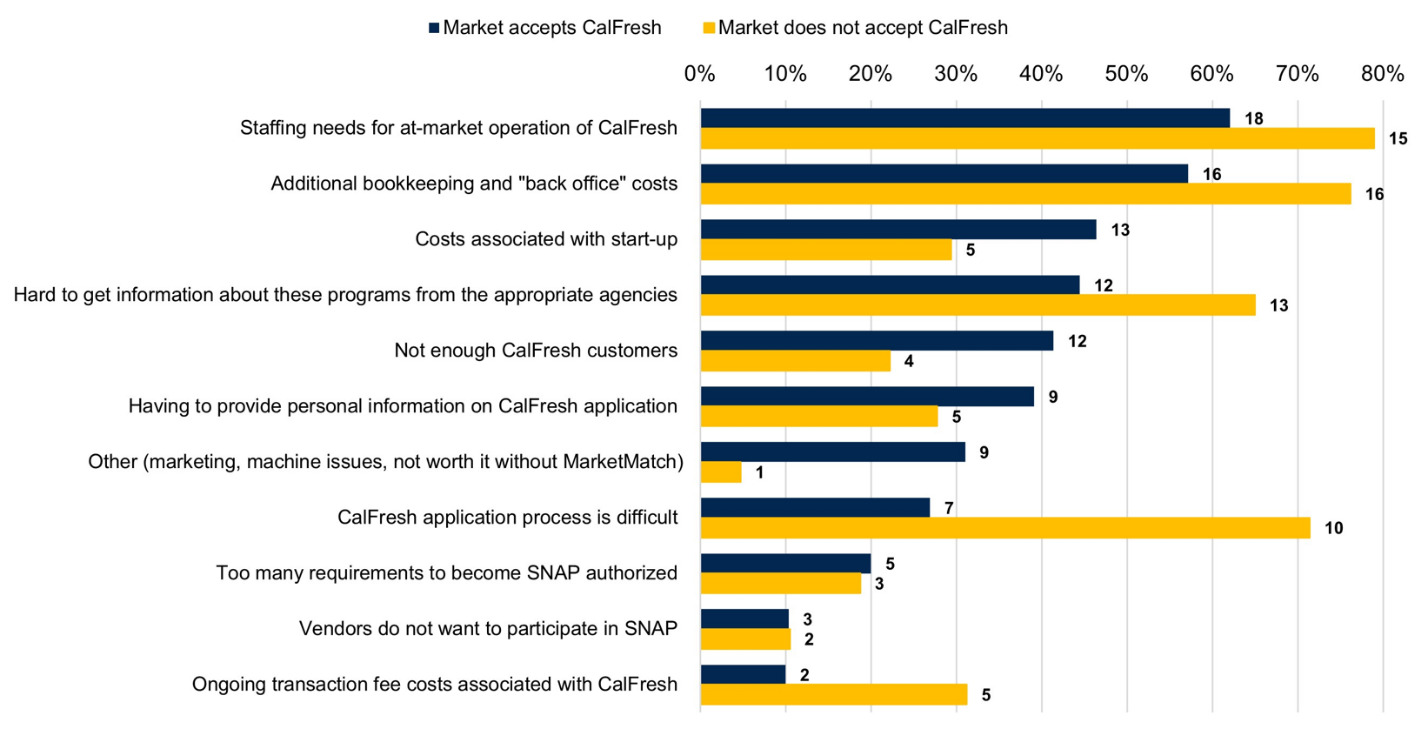
All perceived challenges and their frequency of agreement among markets who accepted CalFresh or did not accept CalFresh are shown in figure 2. Among markets that currently accept CalFresh — as well as those that do not — the most common challenges were staffing the booth during market hours (51% and 63%, respectively) and the additional bookkeeping and backend costs (46% and 67%, respectively). Markets that did not accept CalFresh were more likely, when compared to markets that accepted CalFresh, to agree that they perceived barriers related to communicating with the relevant agencies (54% vs. 35%), the application process (42% vs. 20%), and the related transaction fees (21% vs. 6%). In contrast, markets that currently accepted CalFresh more frequently identified other barriers, often relating to the implementation of the program at their market (e.g., marketing), in comparison to markets that did not accept CalFresh (26% vs. 4%).

Among markets that accepted CalFresh, the challenges they experienced varied in importance and modifiability
Comparing the quantitative frequency and ranking of perceived challenges with the qualitative sentiments shared during interviews provided additional insights (table 5). Among challenges that were highly prevalent (% agreement ≥ 37%), market manager interviewees had identified solutions that could address these challenges. These identified solutions, such as outsourcing the workload or increasing the amount of paid market staff, were noted possibilities that were not currently available or feasible for the markets. Among challenges that were less prevalent (% agreement ≤ 35%) but often ranked as the most important when compared with other challenges (rank ≤ 1.7), interviewees provided detailed descriptions of these barriers, often relying on their own personal experiences. Despite the detailed understanding of these challenges, managers were less likely to describe potential solutions, whether feasible or otherwise. Finally, among challenges that were both least prevalent (% agreement ≤ 26%) and commonly ranked as less important when compared with other challenges (rank ≥ 2), interviewees described their experiences in less detail and reflected a neutral or limited emotional response to the challenge (e.g., using terms like “irritated” or “uncomfortable”).
Lack of customers was, by far, the most common challenge of FMNP participation for markets
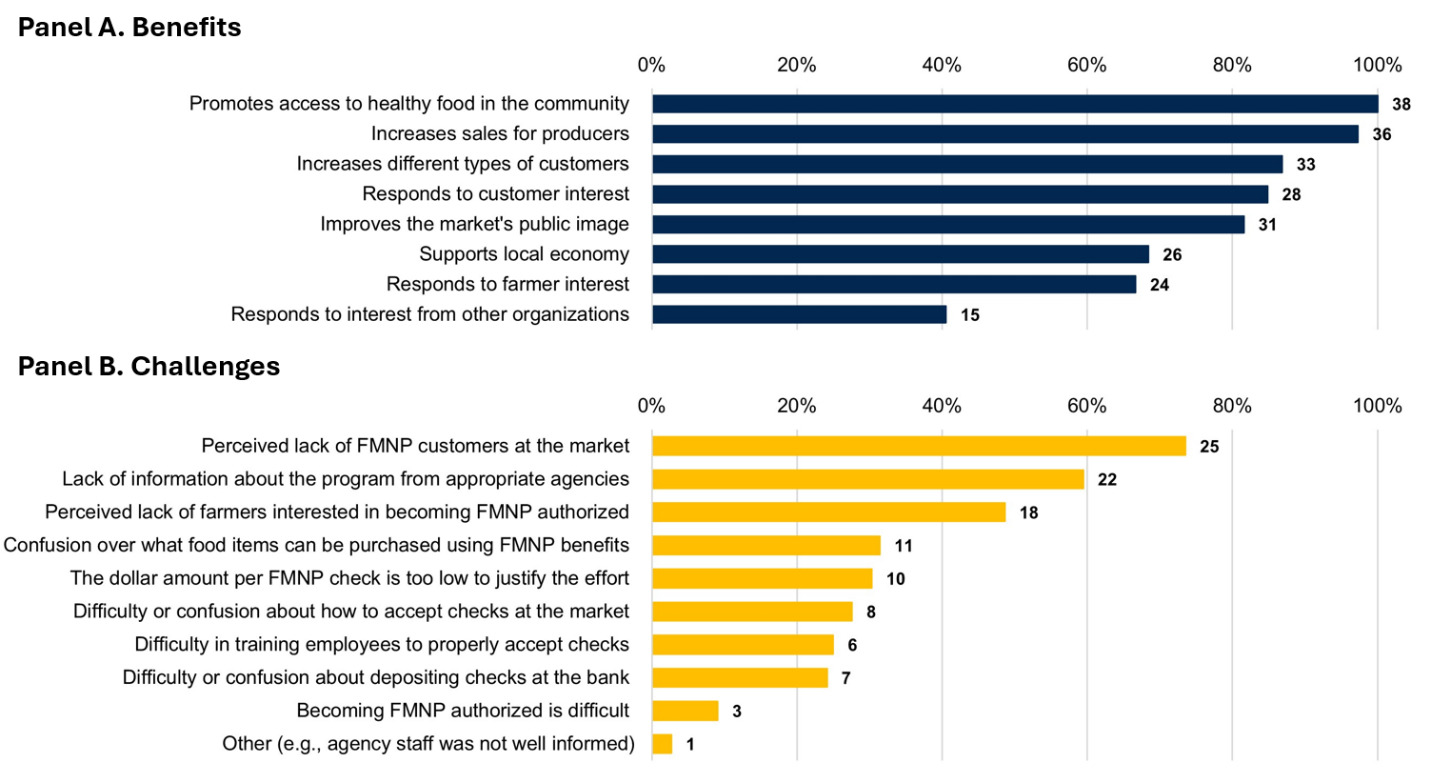
Almost three-quarters of markets participating in FMNP perceived there was a lack of FMNP customers (fig. 3). Other common challenges included a lack of information about the program from the appropriate agencies, and a perceived lack of farmers interested in becoming FMNP authorized. The remaining challenges were agreed to by 31% or less of FMNP-participating markets.
Among markets that participated in FMNP, there was consistent agreement for perceptions of various benefits to community members, producers, and the market
When we asked managers about benefits to the FMNP program at their market, 100% of respondents agreed that it promotes access to healthy food in the community (fig. 3). Of the remaining seven statements about potential benefits, six were agreed to by 65% or more of the participating markets.
Discussion
Program availability variation by farmers market operator type
Regarding our first research objective, the availability of food assistance programs and the relationships with market characteristics, our findings were consistent with the literature. For example, we found that CalFresh acceptance was more likely among nonprofit operators, affirming the findings of Hasin and Smith (2018) that reporting to a board of directors — characteristic of nonprofit organizations — was positively associated with early electronic benefits transfer (EBT) adoption among Midwest farmers markets. Our finding that markets accepting CalFresh were slightly more likely to be operated by a person or organization managing multiple markets further supports the finding of Dixit-Joshi et al. (2013) that markets actively redeeming SNAP benefits were more likely to be “managed by another organization or association that may also manage other farmers markets” (p. xxii). Dixit-Joshi et al. (2013) also found that SNAP-redeeming markets “tended to have more sources of funding” (p. 33) than non-redeeming markets, echoing our results around the diversity of ways markets covered their CalFresh acceptance costs.
Further investigation is needed to understand why nonprofits are more likely to accept CalFresh than farmer-operated markets while the same disparity does not occur for WIC/Senior FMNP authorization. It may be a difference in staff resources, with nonprofits perhaps having more available labor and resources to complete the more complex CalFresh application.
Resources may also explain the differences in Market Match availability by operator type. Our finding — that only 5% of certified producers offer Market Match versus 90% of nonprofits offering an incentive — is echoed in data from Gantla and Lev (2015), which shows that “community-led and subentity markets more frequently provide SNAP match programs than vendor-led markets do” (p. 58). The authors attribute this to the greater financial stability of community-led and subentity markets, noting that vendor-led markets are the least likely to have additional revenue sources. Gantla and Lev’s (2015) ownership categories are not completely analogous with those we used in our inquiry, which mirror California’s regulations for certified farmers markets. A future investigation might seek to create similar market ownership categories to facilitate comparisons to existing research.
Questions of market ownership type may be particularly relevant to the Sacramento region, where there may be a slightly larger share of farmer-run markets; the 2019 National Farmers Market Manager survey indicated that 70% of markets around the country “reported a board or group of people collectively making decisions” (p. 5), whereas nonprofit operators only make up 61% of our sample.
Perceived benefits and challenges of program acceptance
With regard to Research Objective 2, our findings also resonated with the literature around benefits and challenges to SNAP acceptance. Russomano and Jacobsen (2016) identified that a lack “of administrative staff; limited market manager time; and inadequate knowledge regarding SNAP” (p. 2835) were barriers for non-redeeming markets, which is consistent with our findings that staffing needs, administrative tasks such as bookkeeping and lack of information were the most common challenges for both redeeming and non-redeeming markets.
However, our findings around FMNP contrasted with those reported in the single prior study examining market managers’ perceptions of the program. In Saitone and McLaughlin (2018), only 10% of managers reported a perceived lack of FMNP customers, whereas managers in our sample named lack of customers as their top challenge. Similarly, 70% of managers in Saitone and McLaughlin’s study agreed or strongly agreed that the $30 FMNP voucher amount was too low to justify the effort of becoming authorized, but in our sample only 30% of managers agreed or strongly agreed that the voucher amount was a challenge.
Limitations
Several factors limit the completeness and relevance of our data. First, it is possible that the incentives provided for respondents to complete the survey may have influenced participation in the survey and interviews. Though the survey response rate was high, it is unclear if there were systematic differences in participation based on market characteristics, given these data are not publicly accessible. Our response rate to interview requests was lower than the survey, despite offering a more substantial incentive. Interview participants were less likely to represent multiple markets and it is possible their perspectives are thus under-represented in qualitative insights, but it is unclear if offering a larger incentive would have impacted participation patterns.
Another key limitation is our selection of market managers as our only type of interviewee. Food assistance programming at markets may include other important actors with whom we did not speak. For example, a few markets work with office managers who may be more familiar with administration and finances. Market managers in our sample reported a lack of familiarity with the particulars of the FMNP program because they did not directly accept the vouchers.
California’s transition to electronic benefits distribution and redemption for the WIC/Senior FMNP means that some of our data may be less applicable. Concerns around how checks are deposited at the bank, for example, are no longer relevant, and participating farmers may experience a different set of challenges and benefits now that they are required to use smart devices to accept benefits.
Our survey itself had a number of limitations that could have been improved. Due to a technical error, markets that were not authorized to accept FMNP benefits were not asked about potential challenges and benefits. Our survey did not ask which “other incentive programs” were funded by the CNIP, making it difficult to understand the extent of non-CNIP incentive or matching efforts.
Beyond the limitations of the survey, we would have made several other improvements to the way data was collected. We would have expanded our qualitative inquiry to incorporate perspectives from market vendors and other stakeholders to provide a more comprehensive understanding of perceived challenges and benefits of participating in food assistance programs. We would also have collected data around market governance and ownership characteristics that would have made it easier to compare to similar studies, such as Gantla and Lev (2015).
Conclusions
This study offers a novel approach to surveying farmers market managers about a range of food assistance programs at markets and contributes a methodology that may be helpful to technical assistance providers and extension professionals interested in regional scans in the context of needs assessments. This simple, mixed methods approach may indicate priority clientele and inform extensionists’ understanding of their information needs. Our findings around the relationship between operator type and program availability, as well as those around common challenges of each program, clarified future extension work in the Sacramento region. They point to the need to collaborate with markets operated by certified producers who are interested in accepting CalFresh; work with community organizations interested in partnering with markets to support the availability of food assistance programs; and create educational resources for market managers around a diversity of funding and staffing models that support CalFresh acceptance.