Farmers in California have been leaders in organic agricultural production since its inception (Guthman 2004). Even with broader adoption in the mainstream (Merrigan 2021), organic farming and food remain important in California. The state leads the nation in (1) certified organic farm sales, with $3.7 billion in 2022, comprising 38.9% of national organic farm sales (NASS 2024b, 620); (2) the number of organic farms, with over 3,039 organic farms in 2022, or 17.5% of organic farms nationwide (NASS 2024b, 620); and (3) certified organic land, with 1.8 million organic acres in 2022, making up about 30% of national organic farmland (Raszap Skorbiansky 2025). In 2022, the organic value chain in California involved 3,582 producers, 1,075 handlers, and 166 processors (SOP 2024, 1). These businesses had gross sales of $4.6 billion, $5.5 billion, and $1 billion, respectively, for total organic gross sales (excluding retailers) of $11 billion (SOP 2024, 1).
Looking forward, California’s climate mitigation strategy includes expanding organic farming, with a target of 20% of California cropland being organic by 2045 (CARB 2022). Organic agriculture avoids the use of fossil fuel–based additives, thereby reducing greenhouse gas emissions relative to conventional farming, and holds great potential for carbon sequestration (Boschiero et al. 2023; Fuentes-Ponce et al. 2022; Scialabba and Müller-Lindenlauf 2010, 158). Because land is managed differently when used for crops versus animal production, California’s climate mitigation strategy focuses on organic transition for cropland specifically to reduce synthetic additives like fertilizers and pesticides. Because few synthetic additives are generally used in conventional pasture management as compared to cropland, organic pastureland transition may be faster (Raszap Skorbiansky 2025), but with limited impact on greenhouse gas emissions. For animal production, California’s climate strategy focuses on reducing dairy and livestock methane emissions through manure management as a more impactful approach (CARB 2022).
Within California, a large challenge for policymakers and organic advocates is that we do not know the relative contributions of cropland and animal agriculture to recent organic acreage trends. This distinction is important for tracking progress towards California’s cropland-specific organic expansion goals and for broader organic conversion tracking efforts, especially because increases in total organic acreages do not necessarily reflect increases in organic cropland specifically. For example, Australia’s organic production acreage has grown to about 130 million acres as of 2023, making up more than half of all 245 million acres of global organic agricultural land (Willer et al. 2025). But nearly all (99%) of this land is dedicated to animal grazing (Willer et al. 2025).
The main sources of publicly available organic acreage data in California are (1) California’s State Organic Program (SOP) and (2) the U.S. Department of Agriculture (USDA) National Agricultural Statistics Service (NASS). All producers of raw agricultural products sold as organic in California, including those exempt from federal organic certification (with gross sales under $5,000), must complete a registration process with SOP (AB-1826 Organic Products 2016). Summaries of these data have been published since 1992, first through the Statistical Reviews of California’s Organic Agriculture, published by the UC Agricultural Issues Center from 1992 to 2016 (Klonsky et al. 2002; Klonsky and Healy 2013; Klonsky and Richter 2005, 2007, 2011; Tourte and Klonsky 1998; Wei et al. 2020), and, since 2018, through the California Agricultural Organics Reports published directly by SOP (SOP 2020, 2021, 2022, 2023, 2024). Separately, NASS conducts a nationwide Census of Agriculture every five years. From this census, NASS provides publicly available state- and county-level summaries of agricultural data, including total cropland and animal production acreages, operations, and sales for California and each of its counties (NASS 2024a, 243, 330), and total organic operations and organic sales for California and each of its counties (NASS 2024a, 589).
However, both sources have data limitations that prevent the summation of acreages by total cropland acres and animal production acres. NASS does not publish organic-specific acreages, operations, or sales simultaneously separated by commodity type and geographic area (state or county). And SOP data cannot be used directly to categorize acres of cropland and animal production separately because, since 2018, data have been collected in the registration process using a broad commodity category that includes both crop and animal production. In 2016, the state legislature passed Assembly Bill (AB) 1826 to streamline the state organic registration process and reduce the reporting burden associated with registration (AB-1826 Organic Products 2016). As a result, the Commodity and Acreage Form, part of the SOP organic registration process, now includes 29 commodity categories, one of which is “All Other Field Crops (Including Pasture/Rangeland)” (CDFA 2022). This category, by definition, includes acreages for both cropland (field crops) and animal production (pasture/rangeland). It is also one of the largest California commodity categories in terms of statewide harvested acreage, second only to beef cattle production (SOP 2020, 2021, 2022, 2023, 2024), so differentiating between the cropland and animal production within it is essential to have accurate estimates of these overall categories, but has heretofore been impossible.
In an effort to overcome these data limitations, we developed a method to estimate organic cropland and animal production acreages across California by using proprietary anonymized data from California Certified Organic Farmers (CCOF) to append SOP production site acreage information. In doing so, we answer the following research question: What are the relative contributions of cropland and animal agriculture to overall organic adoption trends in California at the state and county levels? Results demonstrate the importance of tracking these acreages separately to support reaching statewide organic production targets. Further, we propose short- and long-term data improvement strategies for SOP that would address underlying data limitations and position California to lead the nation in organic data as well as production.
Methods
Data sources
We drew upon (1) proprietary anonymized data from CCOF, California’s largest organic certifier; (2) California’s SOP data and various summaries of it; and (3) data from the USDA NASS Census of Agriculture.
CCOF data
As a certifier, CCOF maintains parcel-level data from its certified farmers. The majority of California’s organic producers are represented in these data. According to the federal Organic Integrity Database, about 70% of all organic certified producers in California use CCOF as of March 2025 (USDA Agricultural Marketing Service 2025). CCOF shared with us anonymized, comprehensive, and categorizable details on parcel acreages, crop grown, and crop acreages for each CCOF-certified parcel each year between 2008 and 2023.
From these data, we mirrored instructions for the 2022 NASS Census of Agriculture (NASS 2022) to create statewide and county-level summations of (1) organic cropland production site acreage, (2) organic animal production site acreage, (3) organic fallow and other production site acreage, and (4) total organic production site acreage (see online technical appendix for detailed land use allocation decisions). We use these summations to rectify SOP data and develop estimates of organic acreage by cropland and animal production at the statewide and county levels (see Method 1 below).
Because CCOF data do not include all California organic producers, we validated two main assumptions about these data (see technical appendix for validation details). We assumed that CCOF data are largely representative of the statewide population of registered organic producers in terms of (1) the ratio of cropland and animal production acres, and (2) geographic distribution by county. CCOF clients likely differ from other organic growers in substantive ways outside of these assumptions. Other variations may exist across the various organic certifiers serving California growers or by certification since organic growers with farm incomes below $5,000 are not required to certify but are required to register with SOP. However, the focused scope of our analyses should prevent sample-related variations outside of our validated assumptions from affecting the representativeness of CCOF data for the purposes of this study.
California’s SOP data
For the years 1992 through 2016, we created summations of statewide organic acreage by cropland and animal production directly from SOP summary data published by the UC Agricultural Issues Center (Klonsky et al. 2002; Klonsky and Healy 2013; Klonsky and Richter 2005, 2007, 2011; Tourte and Klonsky 1998; Wei et al. 2020). Animal production acreages were not available for 1992 through 1997, so we only present totals of cropland for those years.
For the years 2018 through 2022, we referenced the total statewide and county organic production acreages listed in the summary data reports published by SOP (SOP 2020, 2021, 2022, 2023, 2024). We used CCOF data to impute organic cropland and animal production acreages from these total organic production acreages (see Method 1).
Because SOP did not publish organic acreage information for 2017, we excluded this year from our acreage estimations (Method 1) and used the average of SOP organic acreage information from 2016 and our organic acreage estimates for 2018 to estimate the organic share of total statewide agricultural production for 2017 (Method 2).
USDA’s NASS data
We used NASS Census of Agriculture statewide and county summations of total (including organic and conventional) (1) agricultural production acreage, (2) cropland acreage, and (3) animal production acreage for each year available since 1992 (1992, 1997, 2002, 2007, 2012, 2017, and 2022) (NASS 2024a). We combined these with our summations and estimates of organic production acreages to calculate statewide and county-level organic shares of total (1) agricultural production, (2) cropland production, and (3) animal production (see Method 2).
Separating cropland and animal production acreage
We utilized two methods to estimate statewide and county: (1) organic cropland and animal production site acreage (Method 1) and (2) organic shares of total cropland and animal production acreage (Method 2).
Method 1: Using CCOF data to impute cropland and animal acreage from SOP data
We used CCOF data to impute statewide and county-level organic cropland and animal production acreages from the later SOP data (2018–2022). For each year (for statewide estimates) and county[1] (for county estimates in 2022), we calculated the proportion of total production site acreage in the CCOF data that belonged in each commodity category (Equation 1)[2] by dividing the production site acreage for each commodity category (cropland and animal production) by the total production site acreage.
PropCategory, Year/County=SumCategory, Year/County(CCOFProductionSiteAcres)SumYear/County(CCOFProductionSiteAcres)
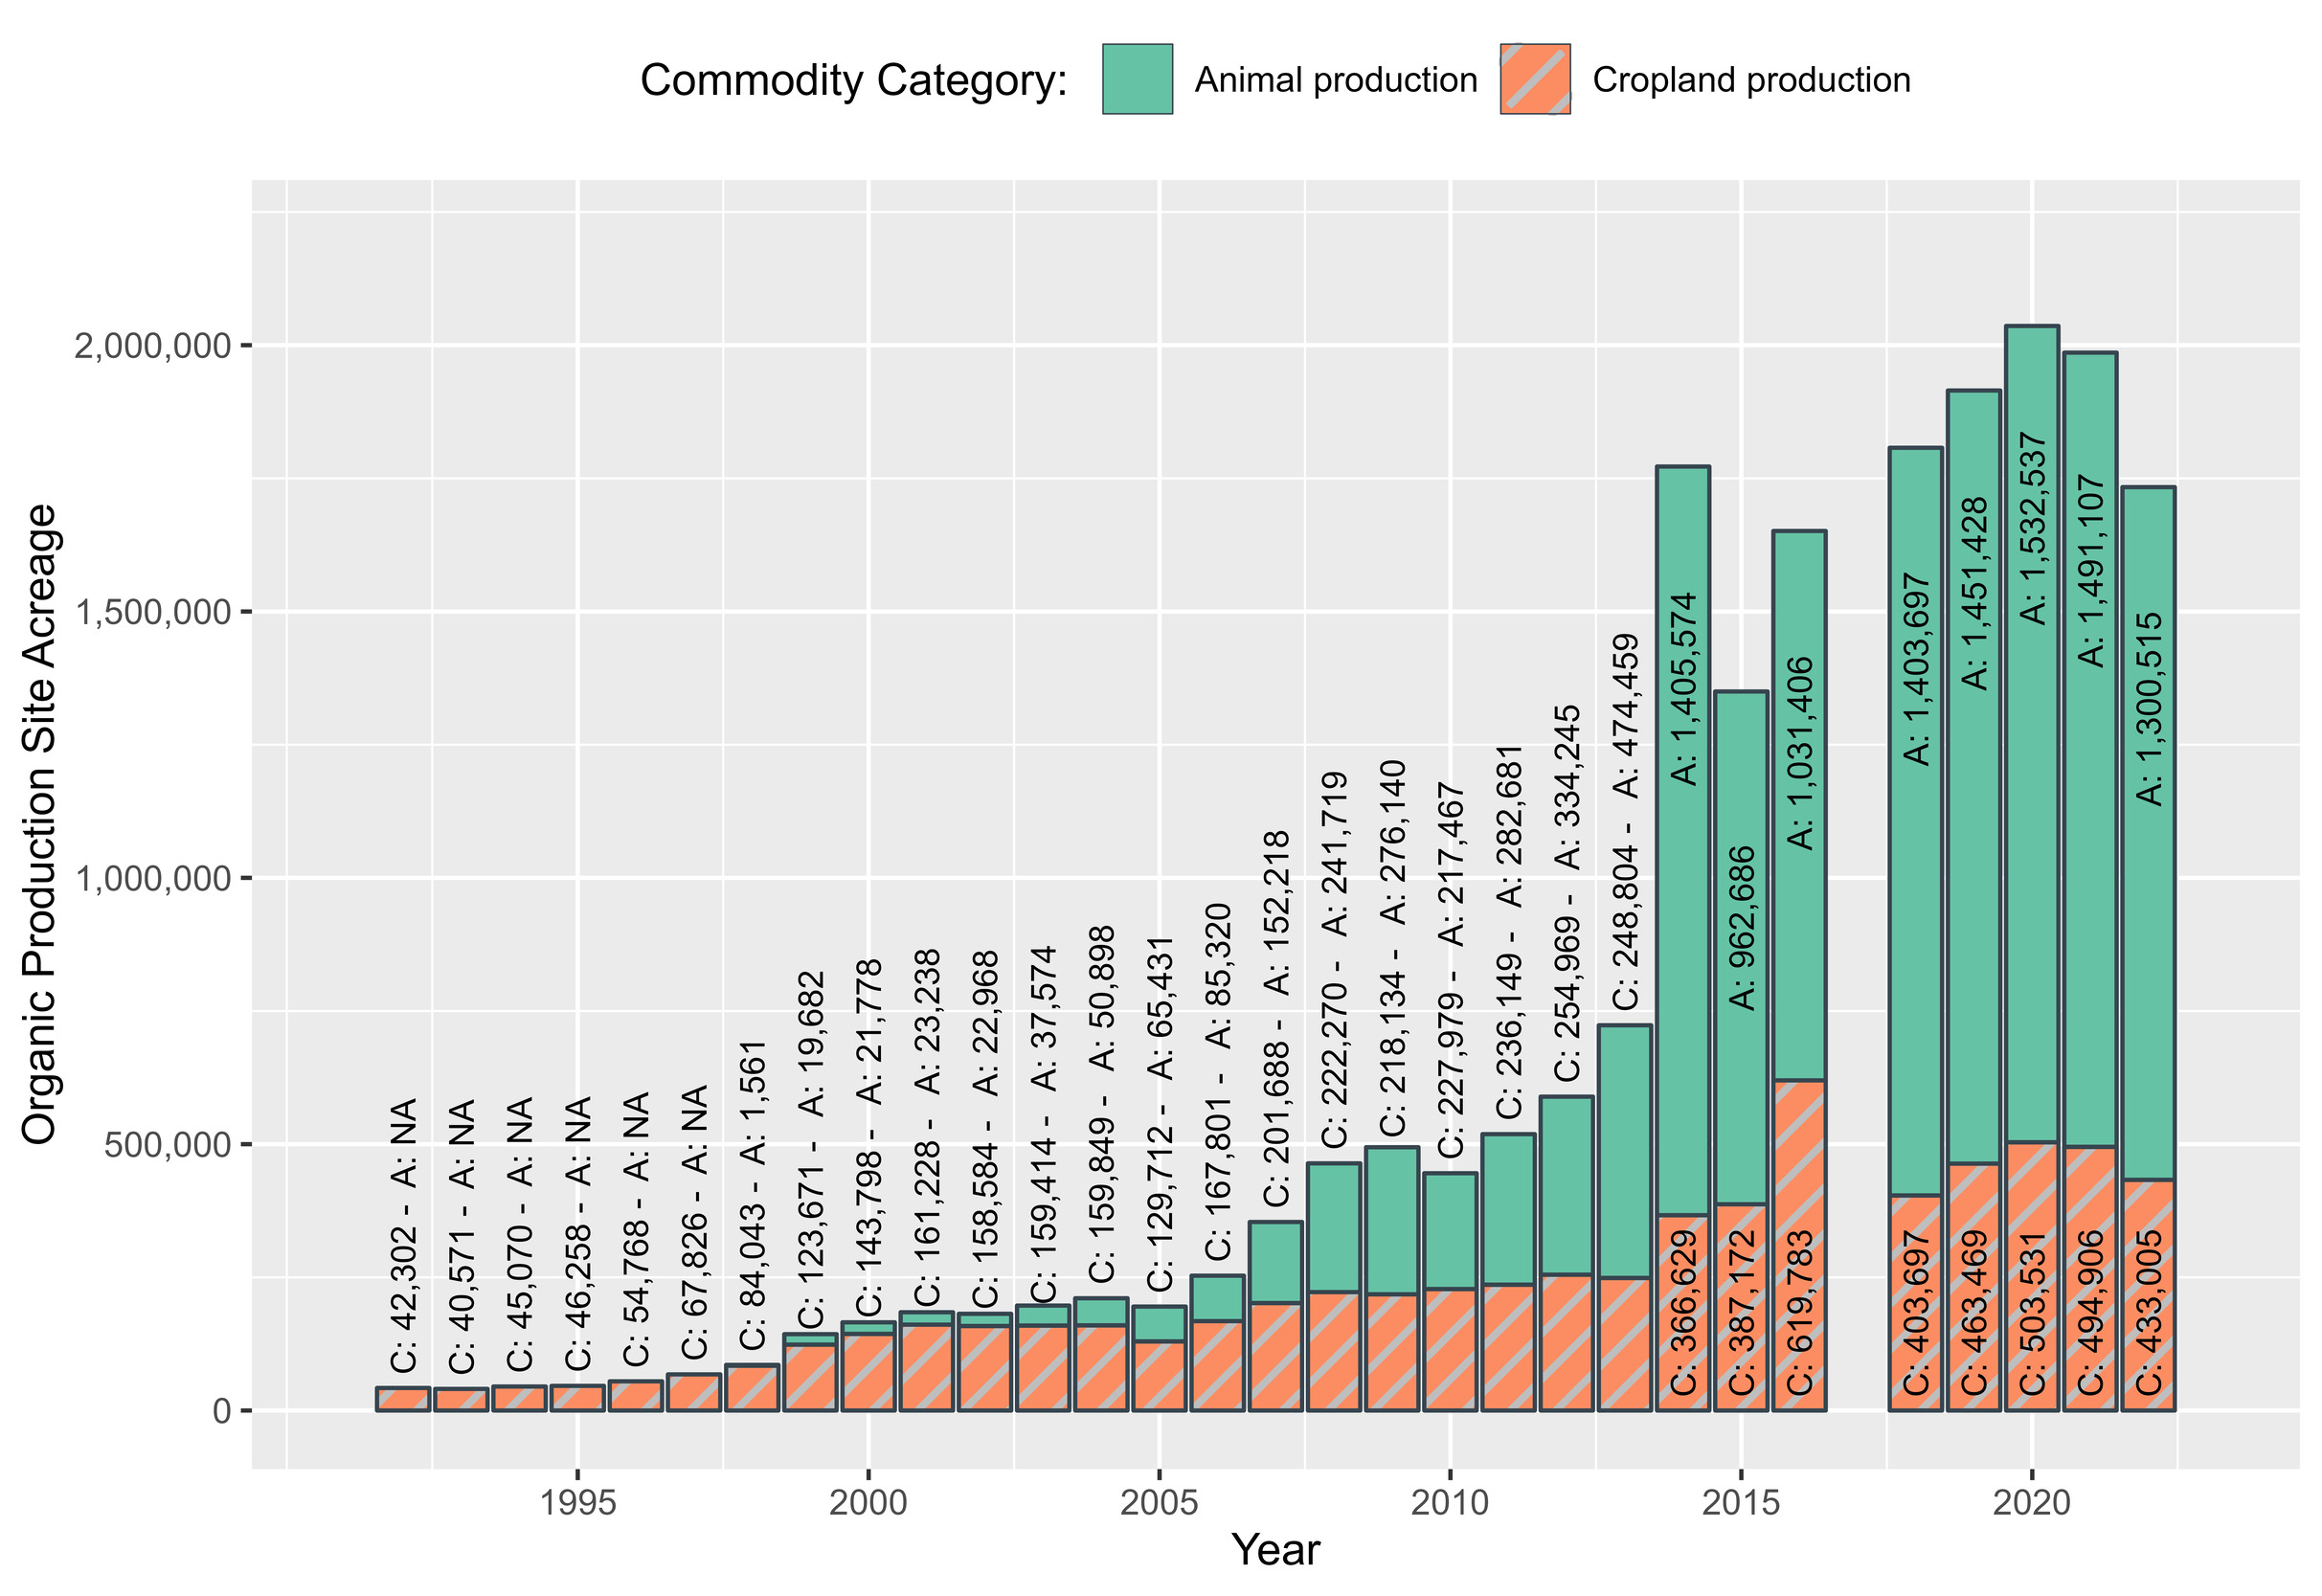
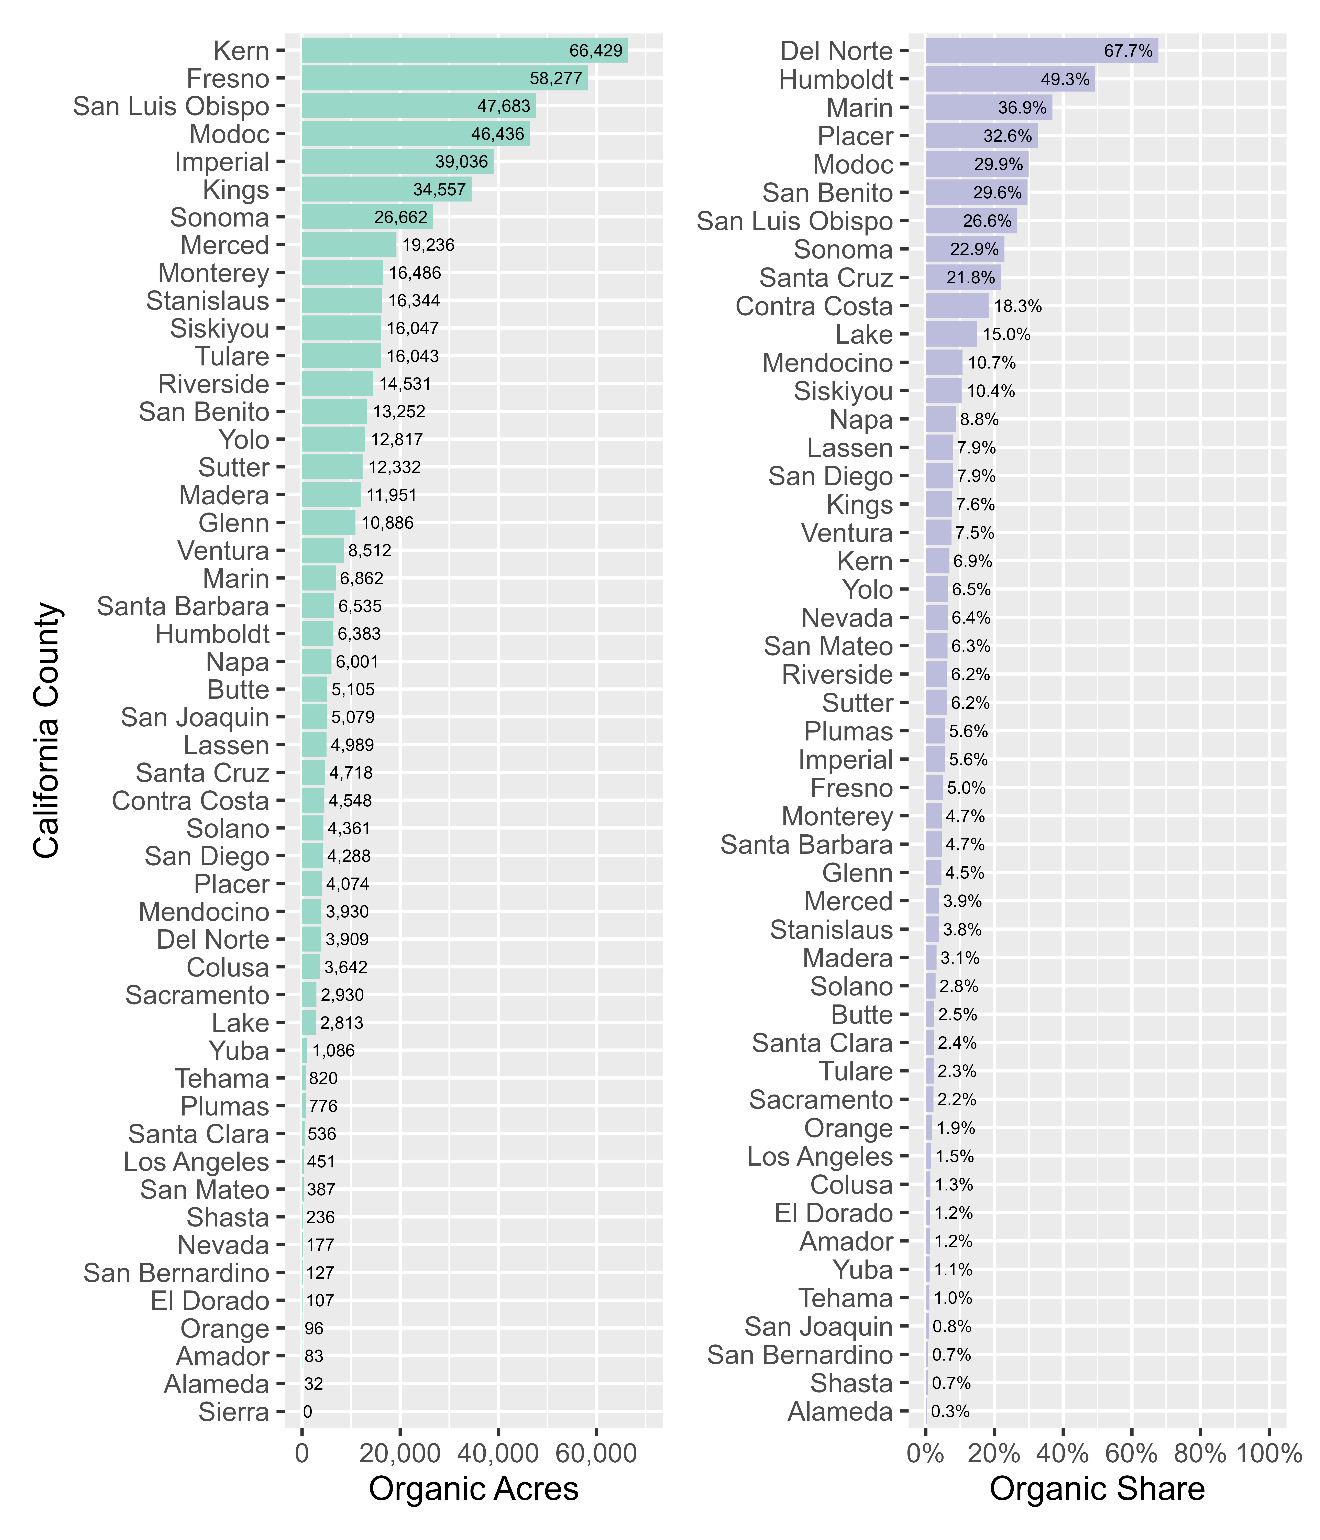
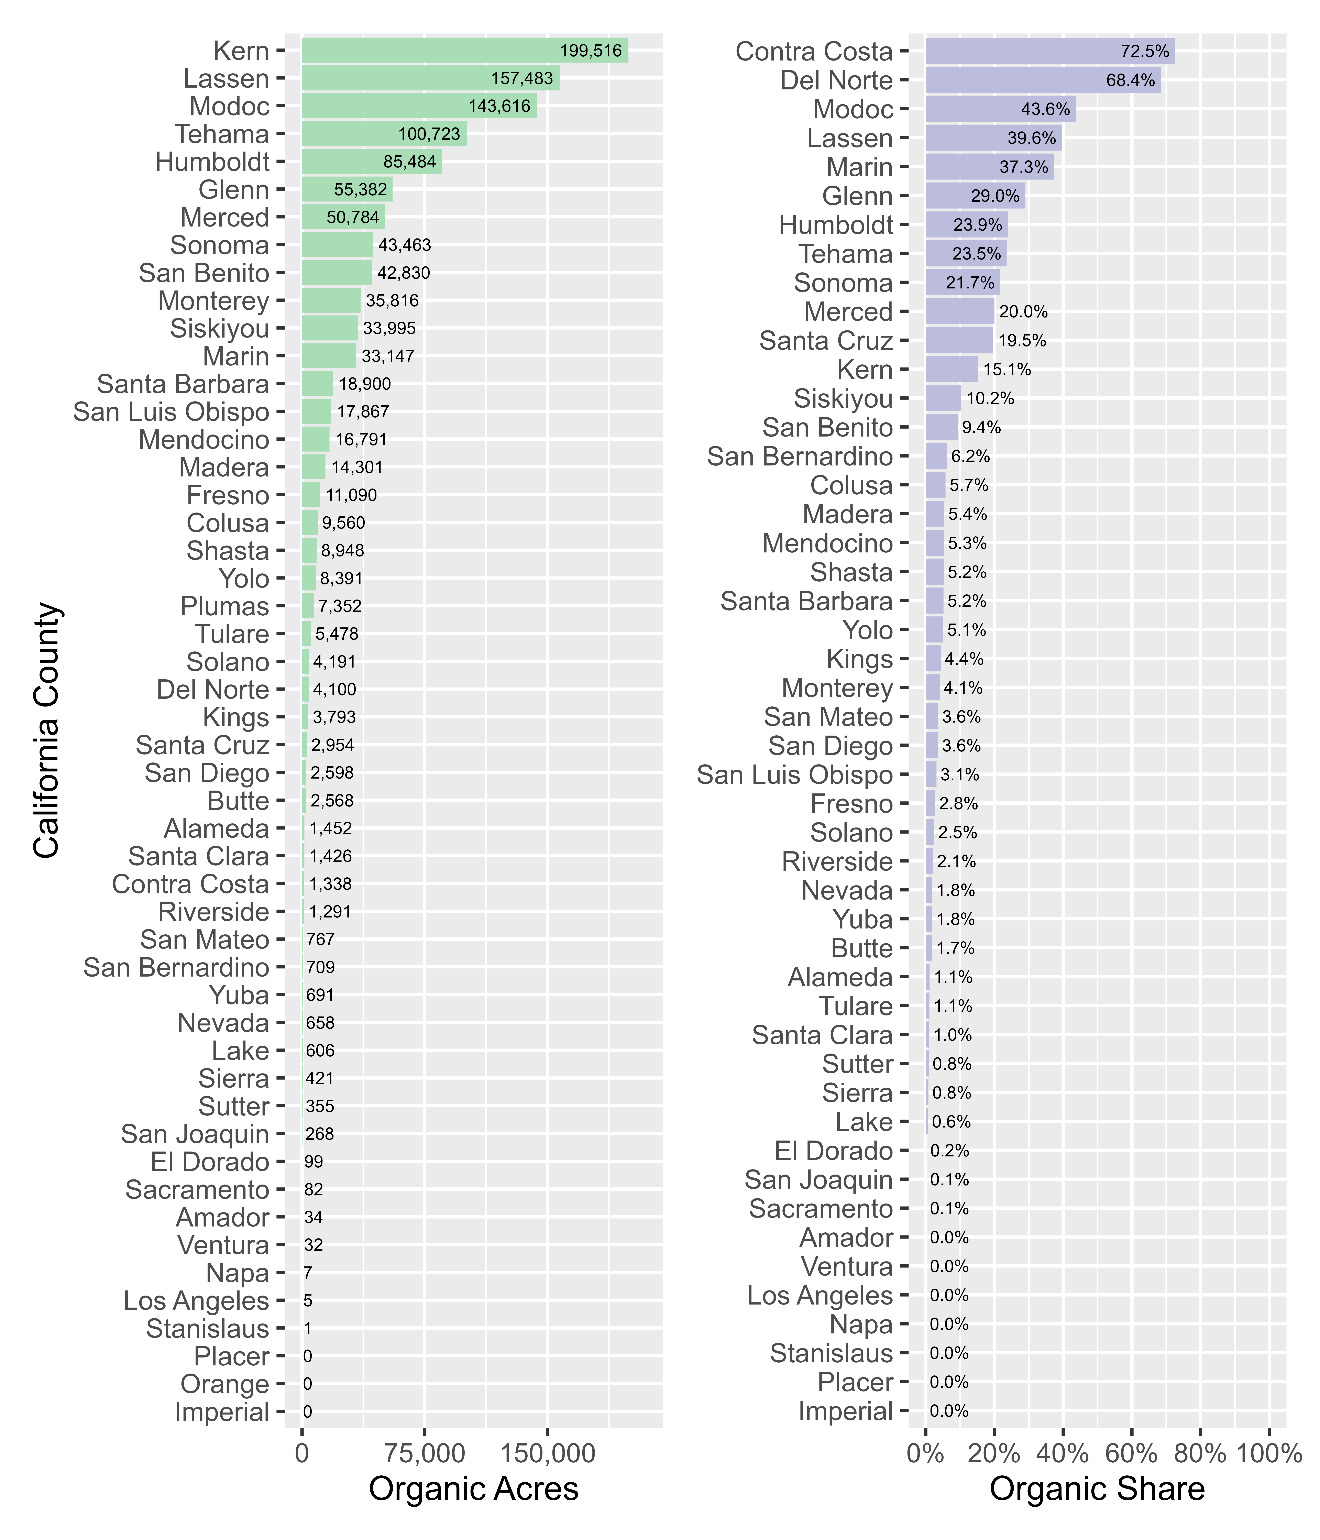
We then multiplied these proportions by the total organic production site acreage reported by SOP for each applicable year and county (Equation 2) to yield estimates of annual statewide organic cropland and animal production from 2018 to 2022 (fig. 1), and county-level organic cropland and animal production for 2022 (figs. 2 and 3). These estimates were also used as input in Method 2 to estimate organic acreage shares.
OrganicAcresCategory,Year/County=PropCategory,Year/County×SOPProductionSiteAcresYear/County
Method 2: Estimating organic shares of total acreages
To control for growth in organic agriculture prompted by a general growth in agriculture, we estimated the organic share of agricultural production by large commodity category, year, and county. We divided our statewide and county-level organic acreage estimates by NASS data on overall agricultural production in California and each of its counties (Equation 3)[3]. We calculated the organic share (proportion) of production site acreage by commodity type and year (for statewide estimates) and commodity type and county (for county estimates in 2022).
OrganicShareAcresCategory/Year/County= OrganicProductionSiteAcresCategory/Year/CountyNASSTotalProductionSiteAcresCategory/Year/County
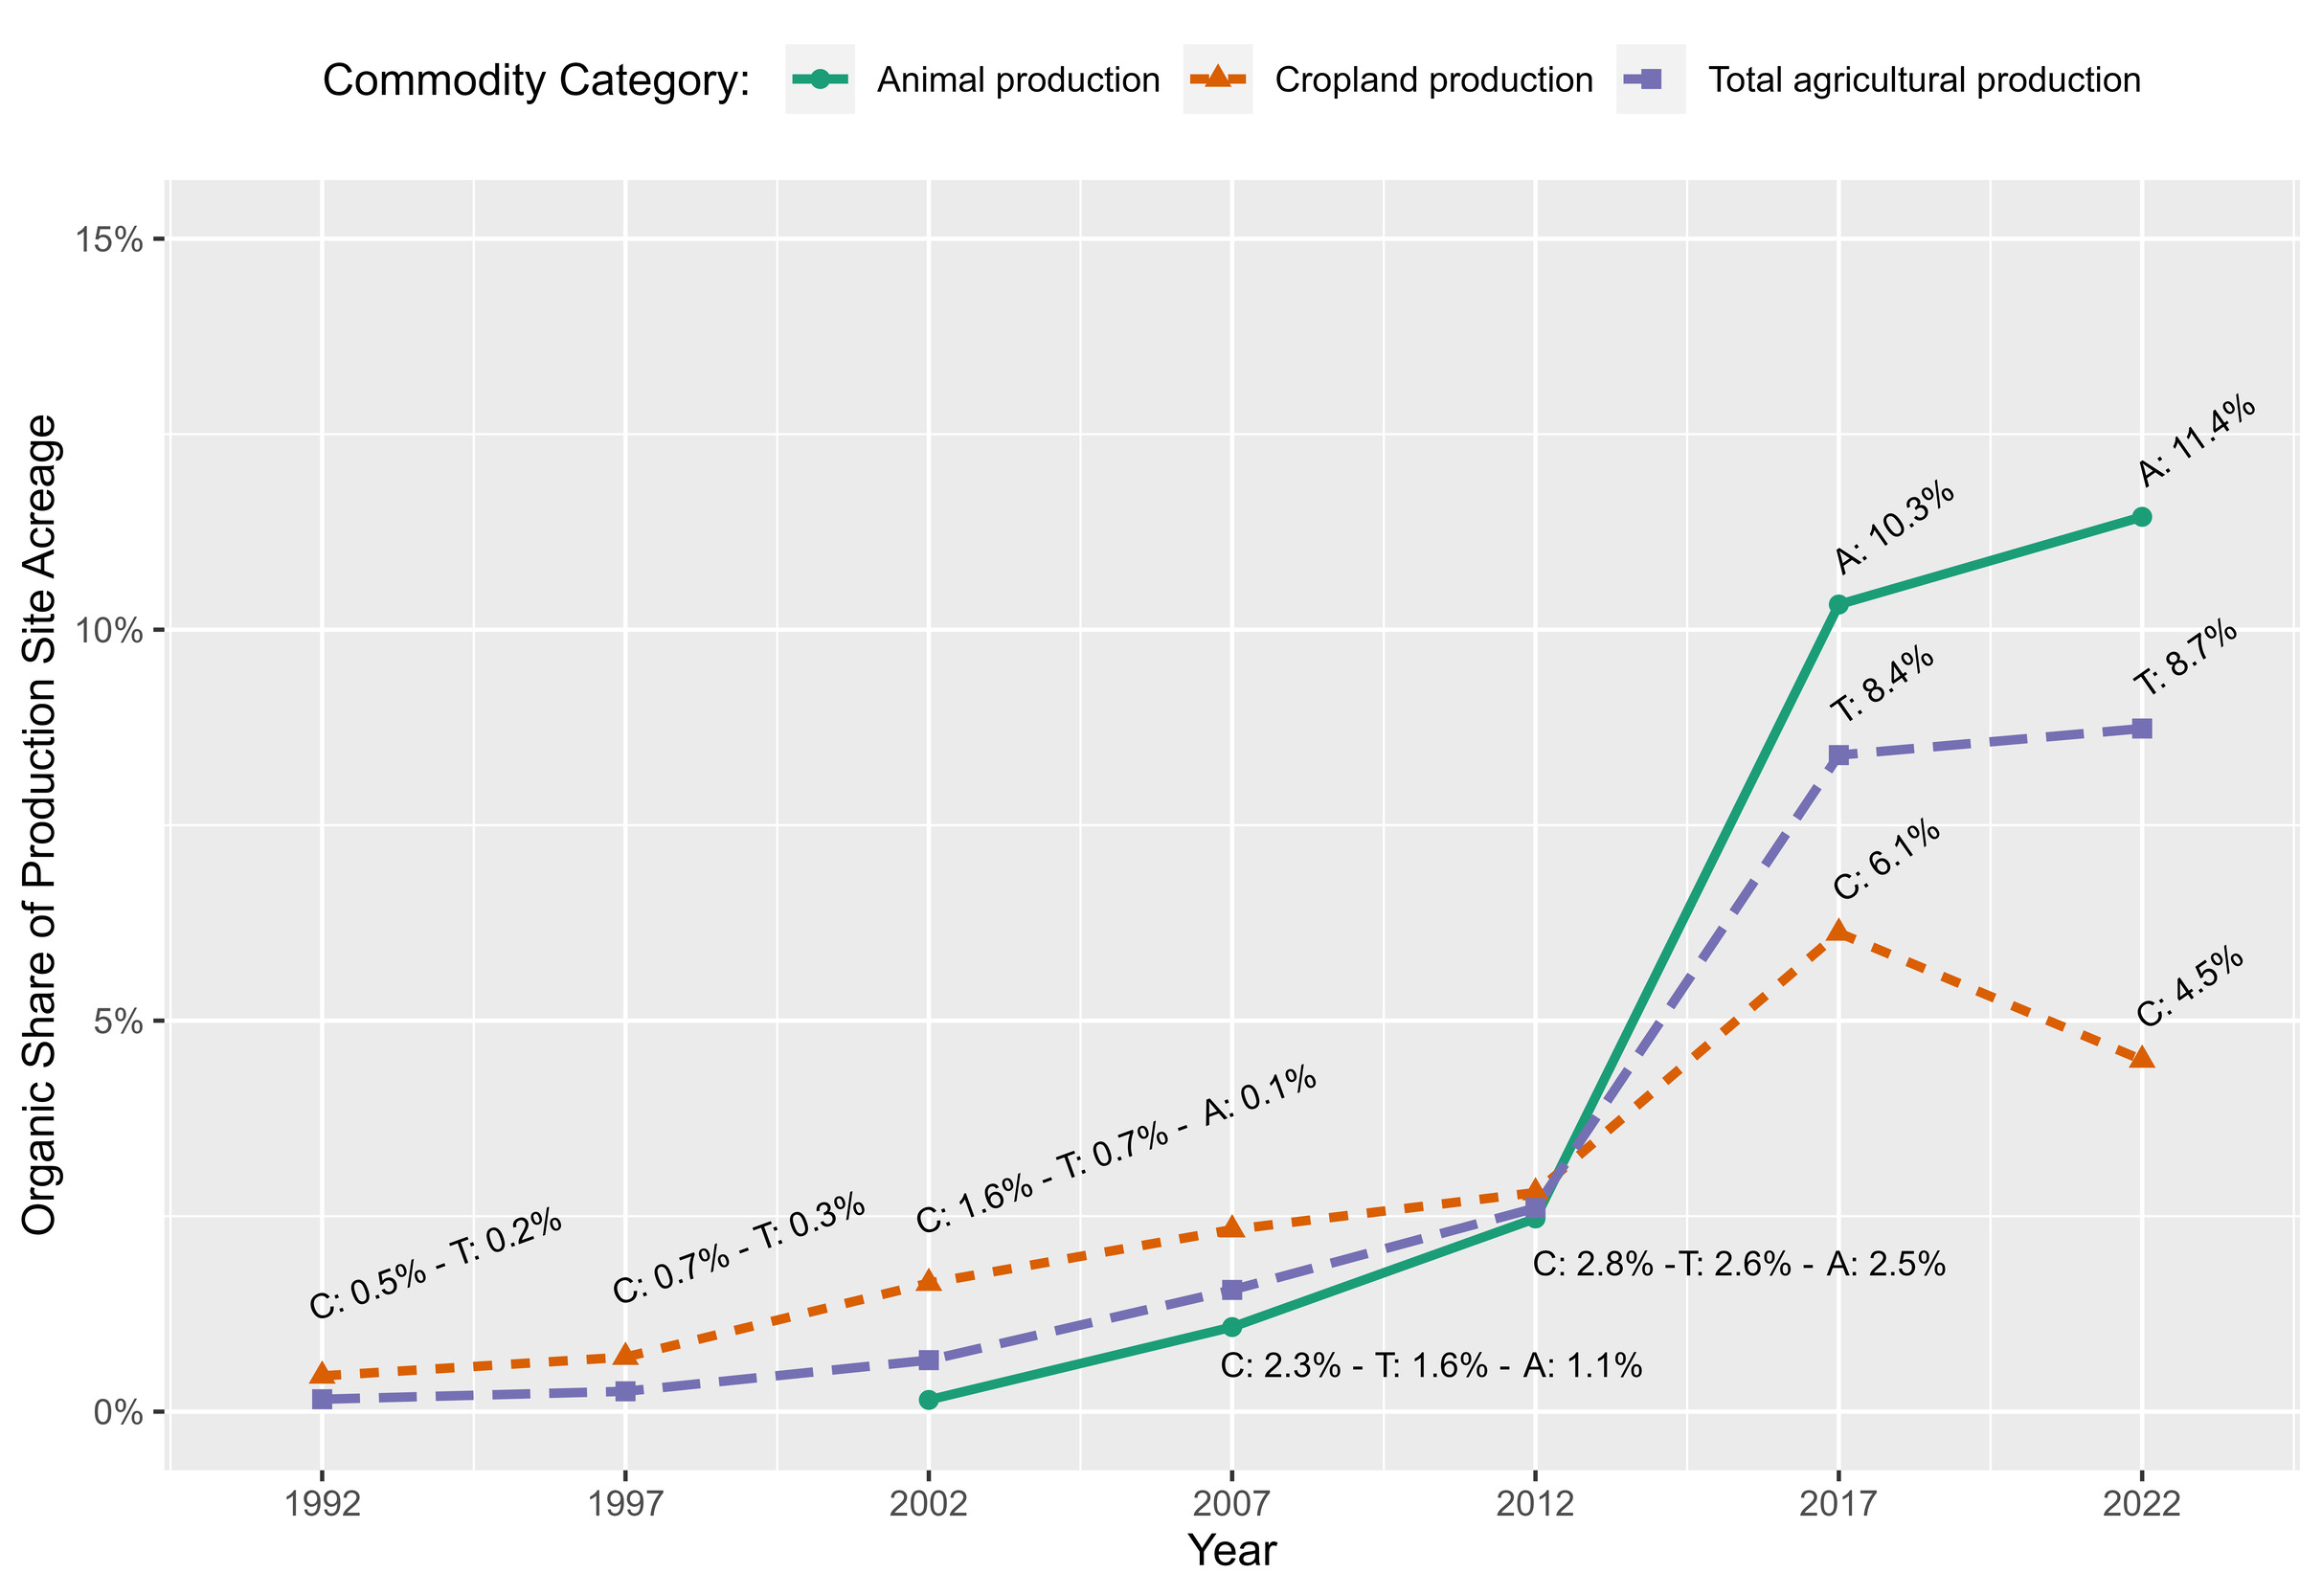
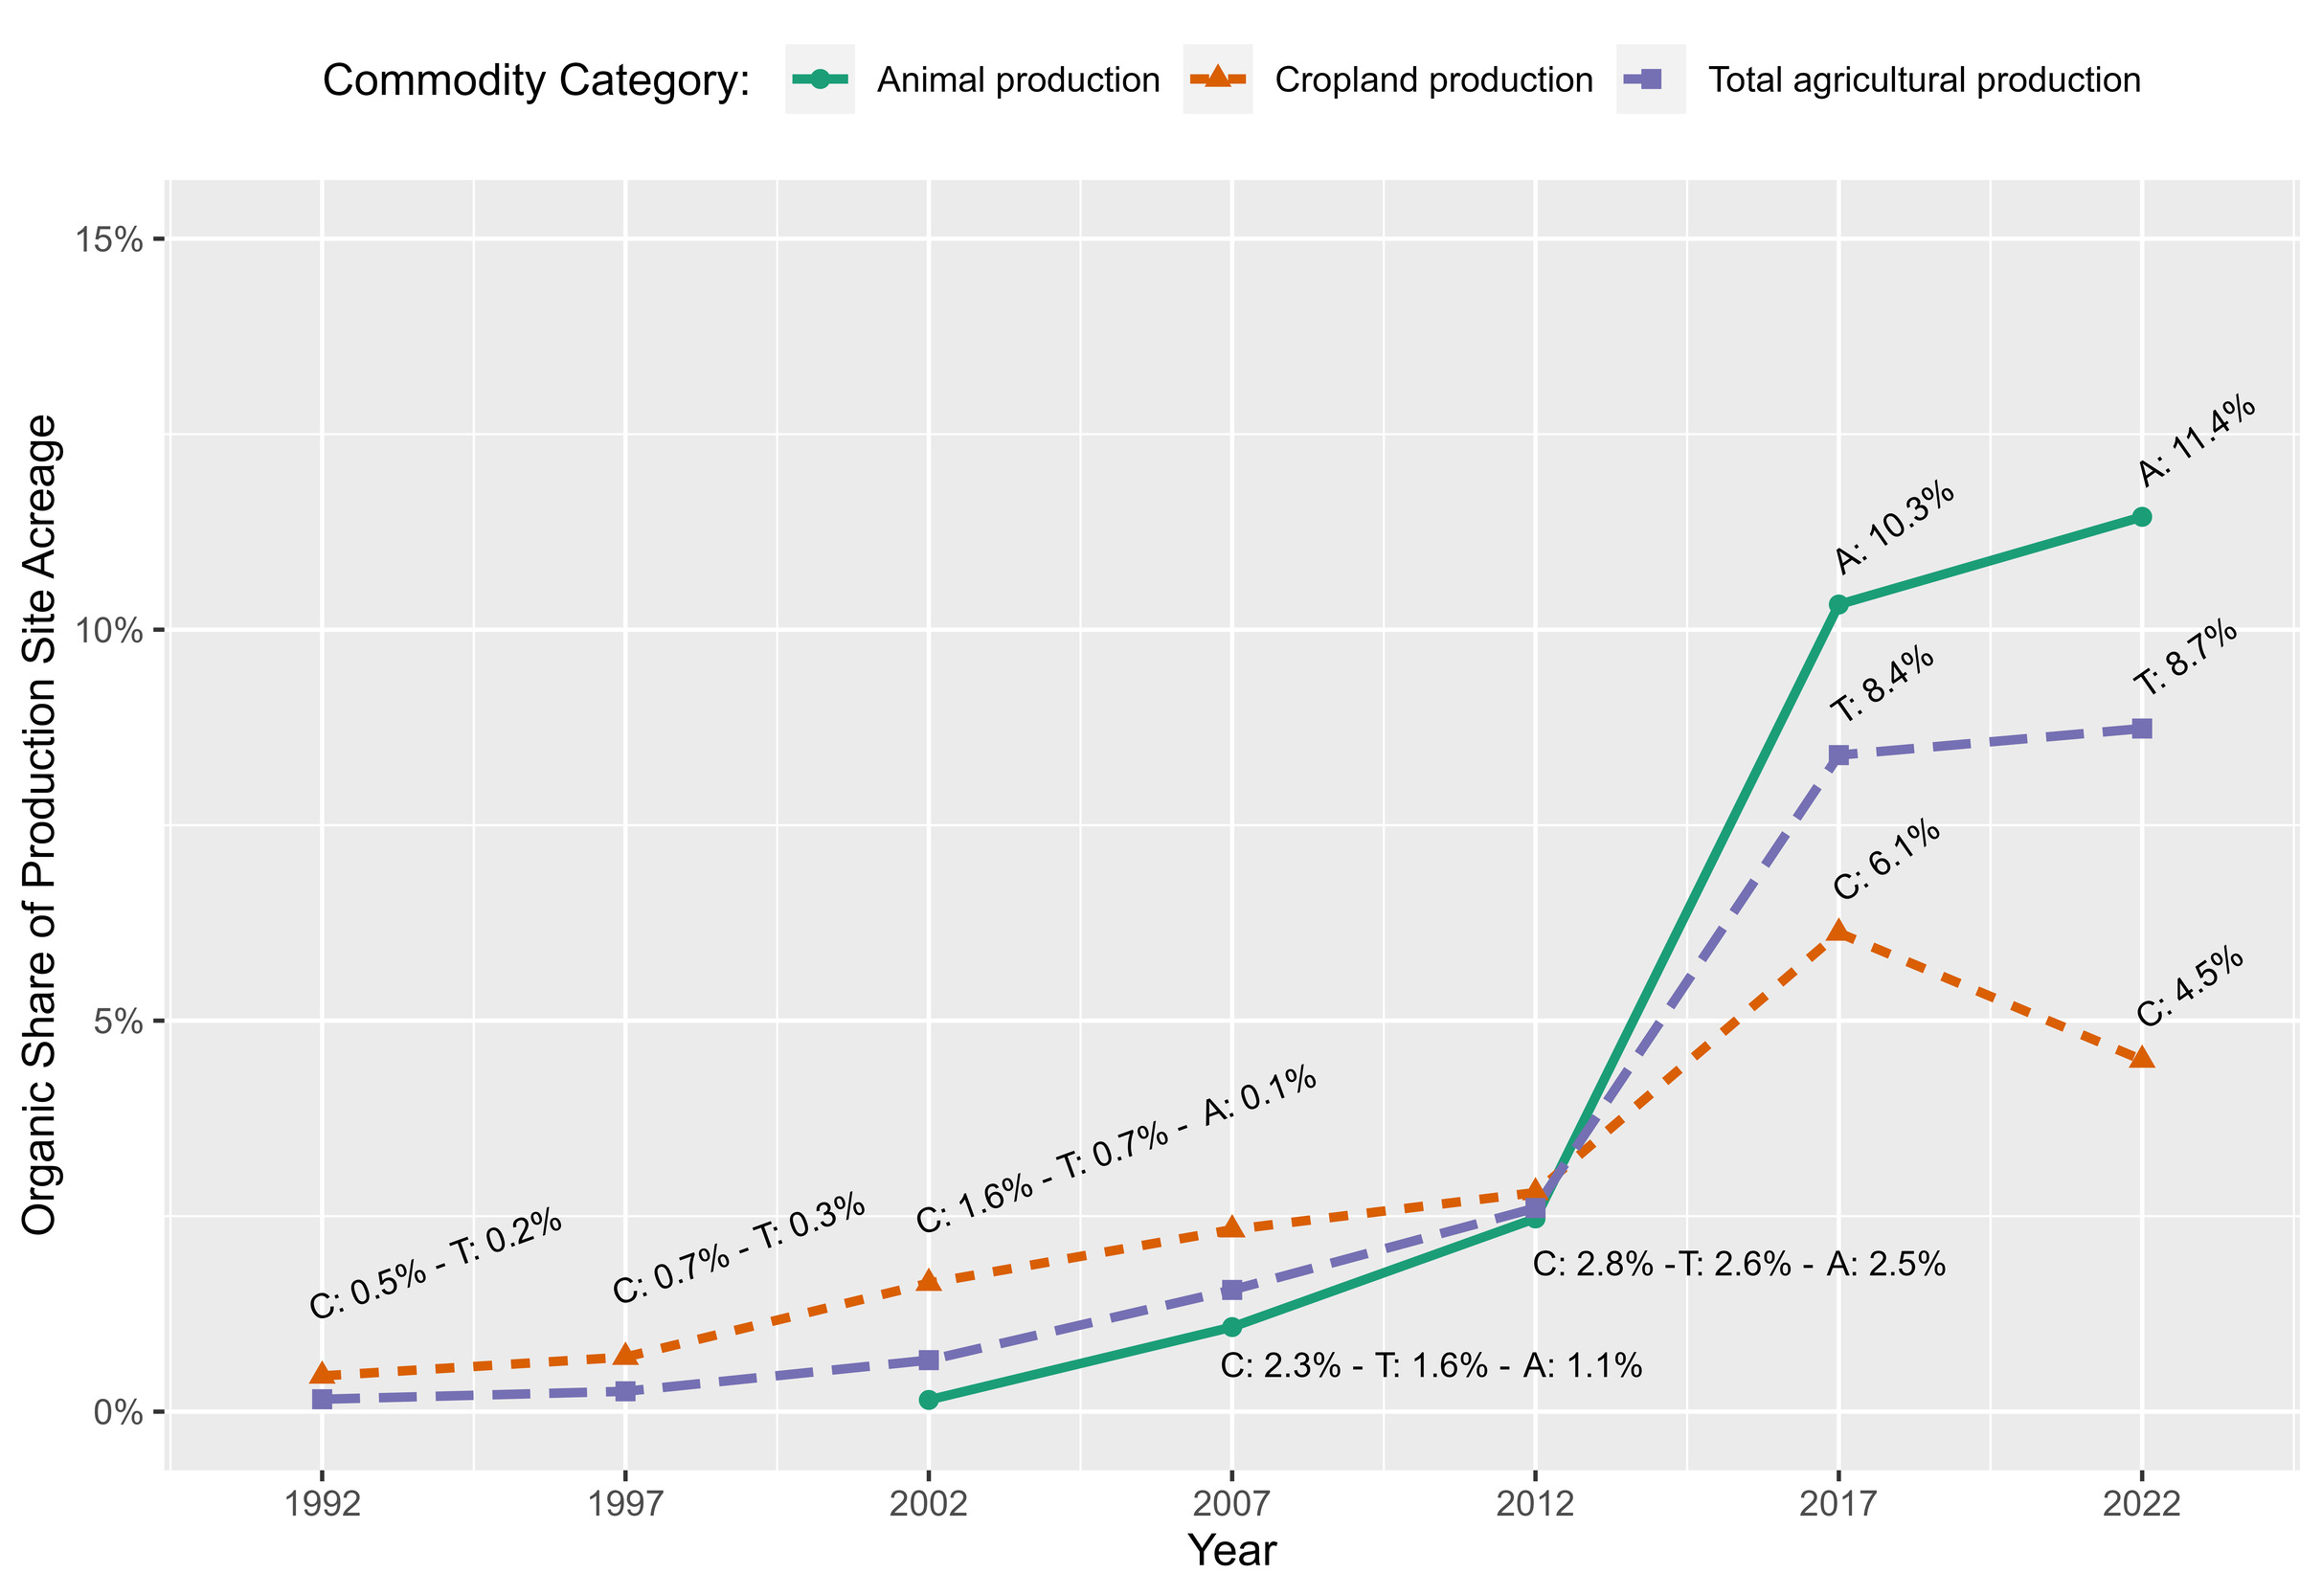
NASS conducts the Census of Agriculture every five years, so we were able to estimate statewide organic shares for 1992, 1997, 2002, 2007, 2012, 2017, and 2022 (fig. 4), and county organic shares for 2022 (figs. 2 and 3). Because there are no SOP data available for the year 2017, we used an average of the organic production numbers for 2016 and 2018 to represent 2017 in our statewide estimates.
Findings
Statewide trends
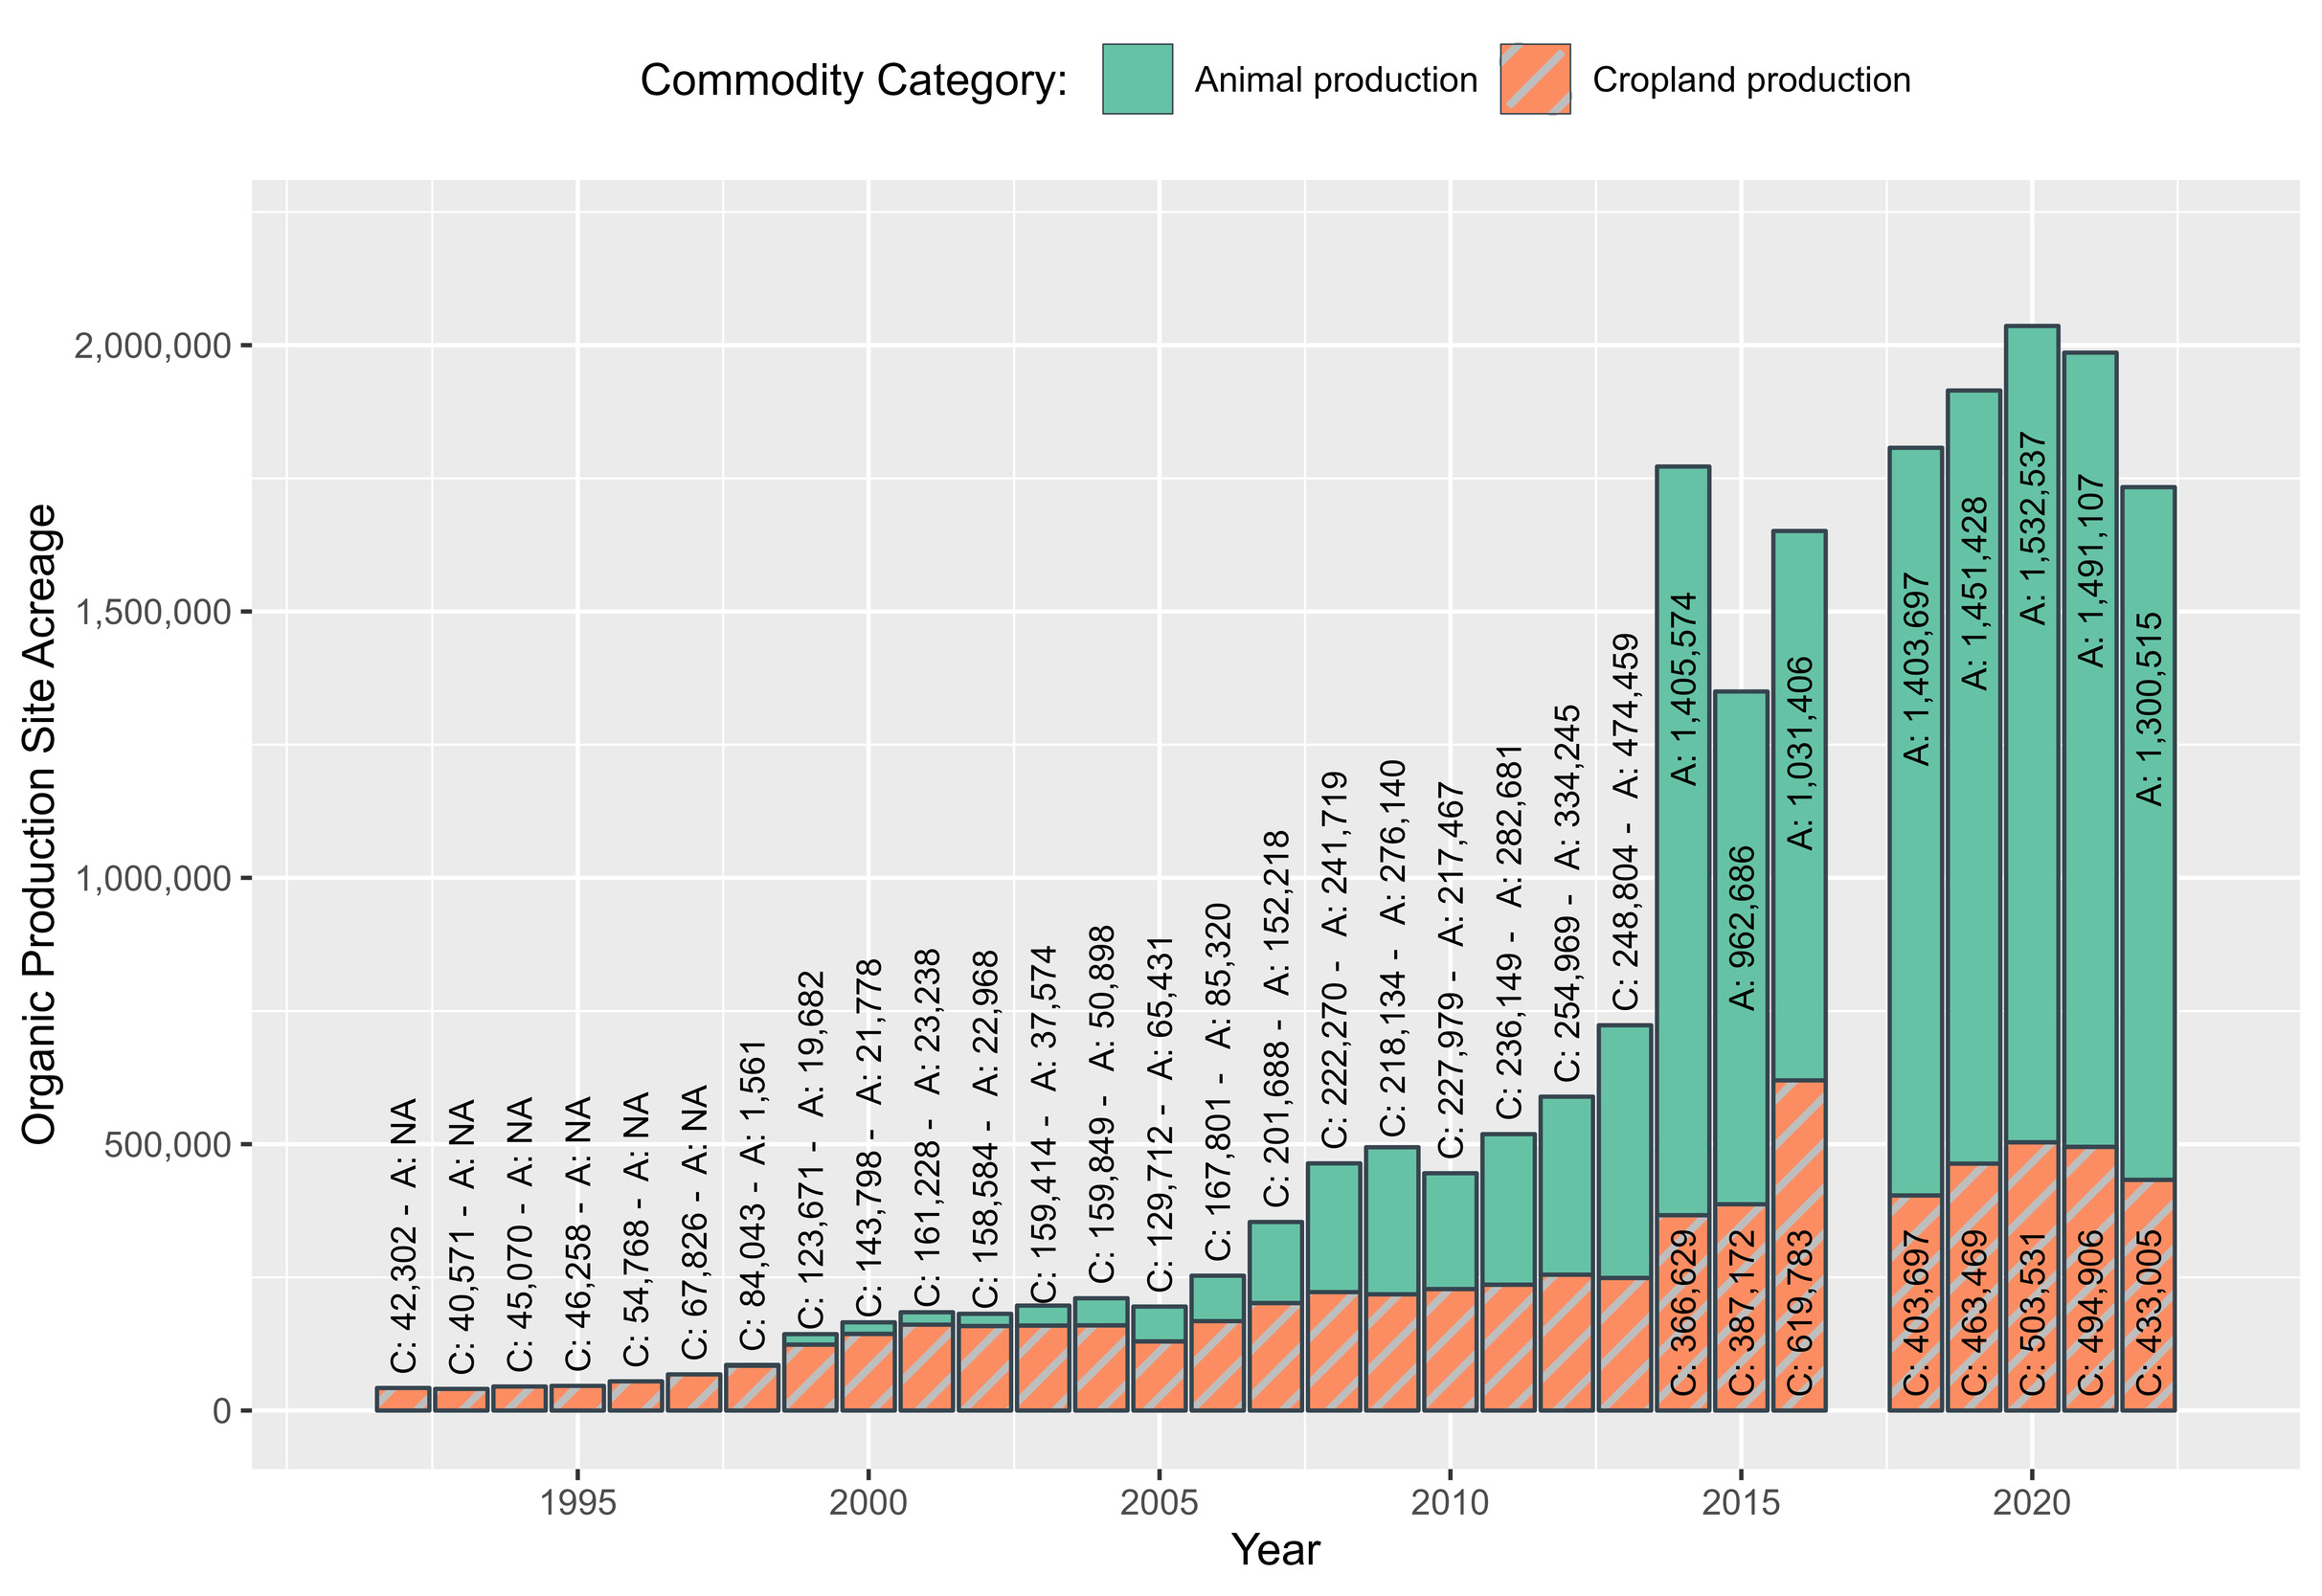
While California’s climate goals focus on organic cropland, animal production makes up a great deal of the growth in organic agriculture since 2014, while the growth in cropland has leveled off since 2020 (fig. 1). As of 2022, just over 430,000 of the organic production acres in California were used for crops, while about 1.3 million organic acres, more than three times as many, were used for animal production. This is a notable divergence from estimates for the nation overall, where cropland acres (over 3.5 million field crops and 1.5 million non-field crops) outnumbered pasture and rangeland (about 3 million acres) in 2022 (Raszap Skorbiansky 2025). Further, the organic share of cropland across California is substantially lower than the organic share of animal production acreage (fig.4). In 2022, only 4.5% of all cropland acres in California were certified organic. In contrast, 11.4% of California acres used for animal production were certified organic in 2022. In recent years, increases in the overall organic share of production (8.7% in 2022) have been disproportionately driven by increases in organic animal production acreage.
County-level trends
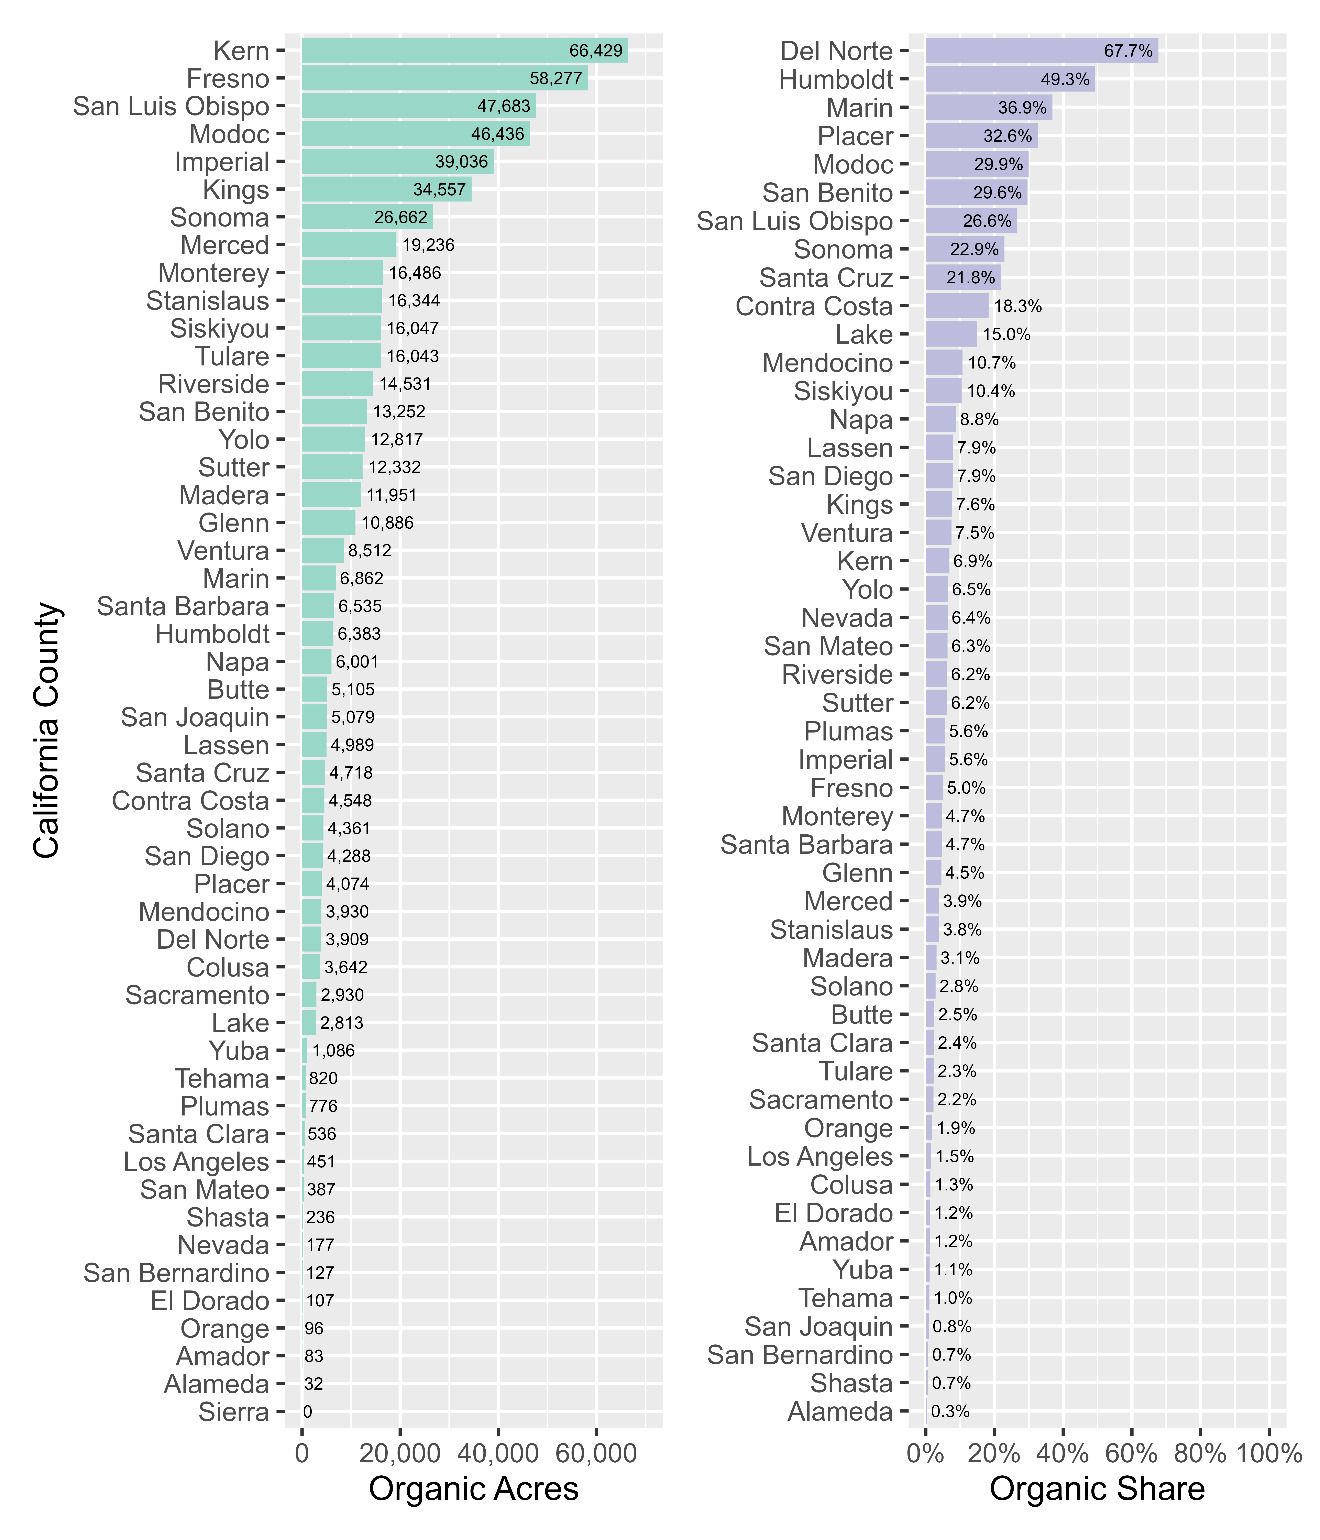
Seven California counties have more than 20,000 acres of organic cropland, including four counties — Kern, Fresno, San Luis Obispo, and Modoc — with more than 40,000 (fig. 2). In nine counties, more than 20% of the cropland is organic, including three counties — Del Norte, Humboldt, and Marin — with organic shares of cropland above 35%. San Luis Obispo, Modoc, and Sonoma counties stand out in these figures with high organic shares of cropland — 26.6%, 29.9%, and 22.9% respectively — and a substantial amount of cropland acres — 47,683 acres, 46,436 acres, and 26,662 acres.
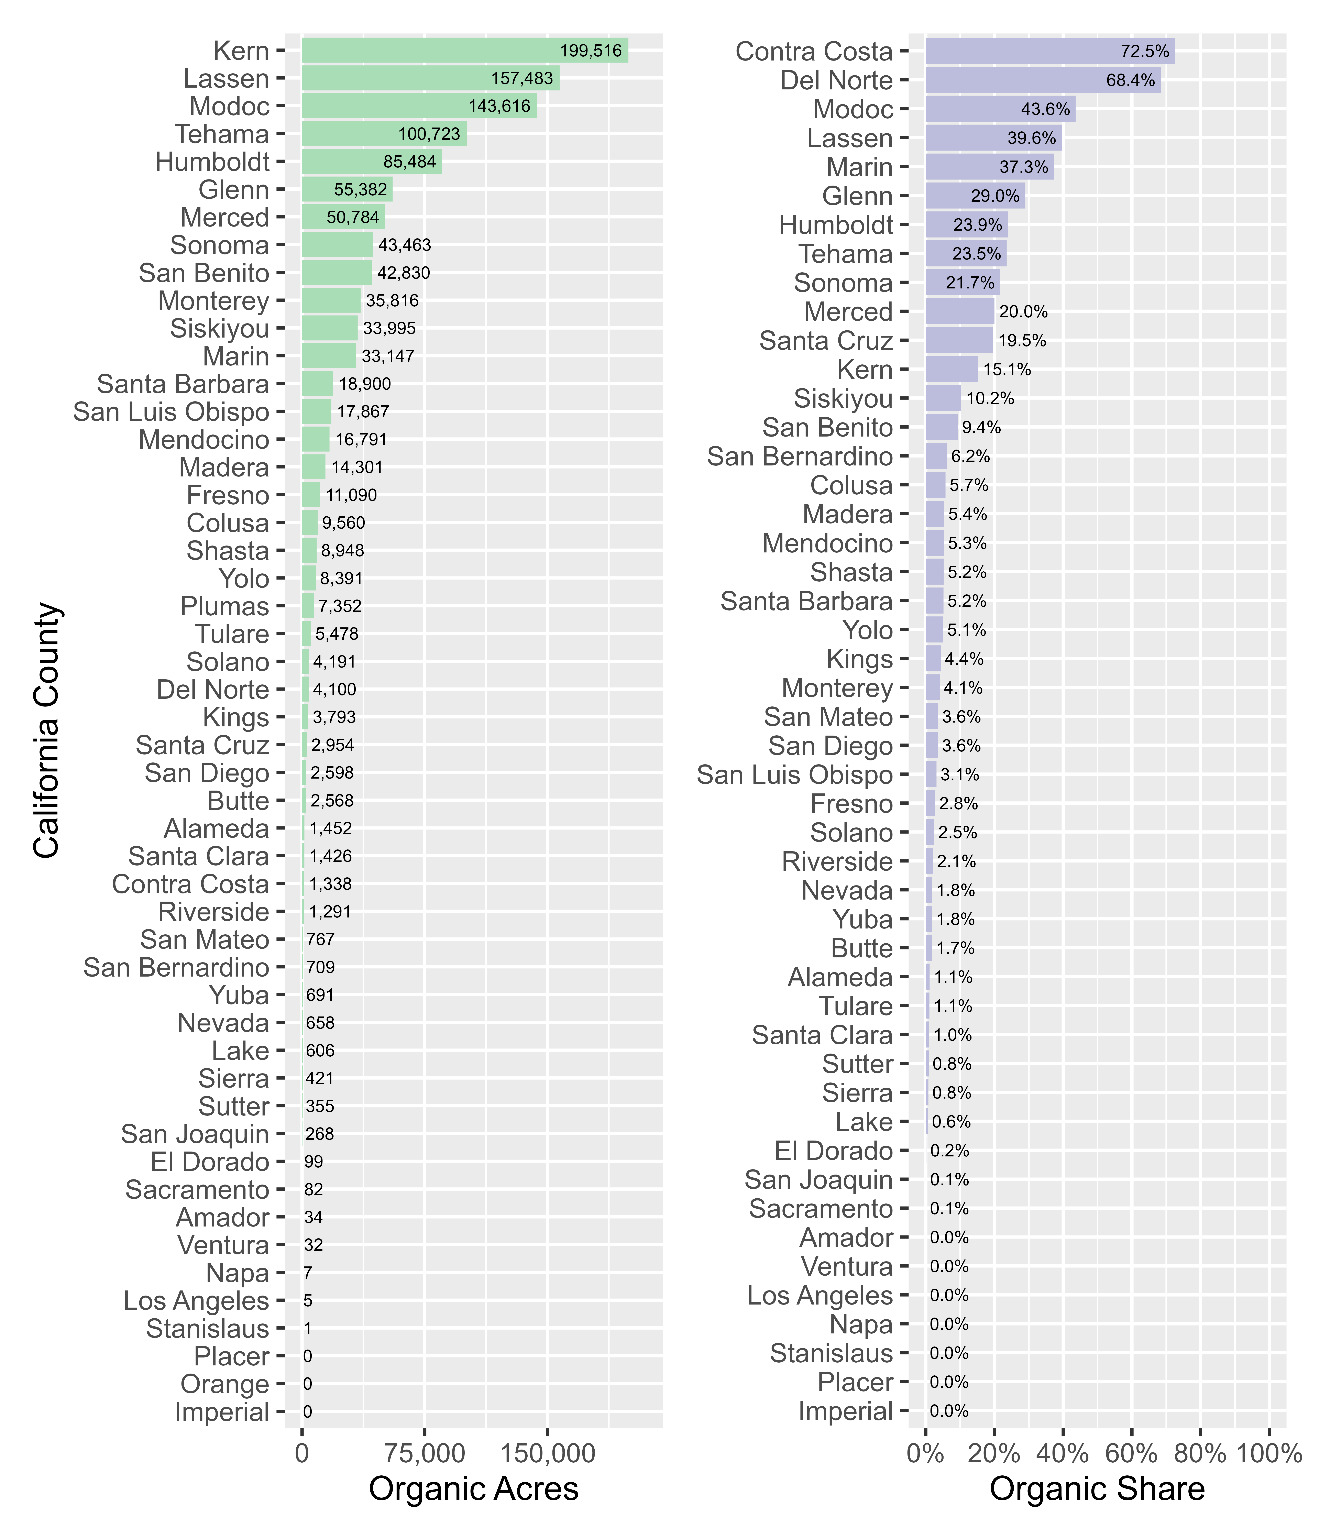
Seven California counties have more than 50,000 acres of organic animal production, including Kern, Lassen, and Modoc, which each have more than 130,000 acres (fig. 3). In 10 counties, 20% or more of all animal production acres are organic; in Contra Costa, Del Norte, and Marin, the organic share is more than 40%. Modoc and Lassen counties both have more acres of organic animal production — 143,616 and 157,483 acres respectively — and higher organic shares of animal production — 43.6% and 39.6% — than most other counties. Glenn, Humboldt, Tehama, and Merced counties also stand out with more than 50,000 acres of organic animal production and 20% or more organic share of all animal production in each county.
Conclusion and recommendations
While market forces played a major role in expanding organic agriculture in California — especially through demand for organic vegetables, fruit, nuts, and dairy within the state, as well as demand across the country — they appear to have run their course in expanding overall organic production acreage, especially with respect to cropland. Indeed, the drop in organic cropland acreage in recent years (first in 2016–2018 and then between 2021 and 2022) shows that the state cannot rely on business as usual to continue to grow organic acreage share. In particular, we estimate less than 5% of statewide cropland is organic as of 2022, highlighting the need for additional efforts to reach California’s goal of 20% by 2045 (CARB 2022). Policy changes — at UC, in California, and nationally — are needed to restart the expansion of organic agriculture. Future research should explore underlying causes of these trends and consider effective policy options for organic expansion. Institutional procurement should be an important lever in increasing local and regional demand in the state. Mitigating the risk of transitioning and addressing competition from imports and other food labels (Raszap Skorbiansky 2025) may also be impactful.
Improving SOP data is critical for evaluating the success of policy changes supporting transitions to organic production moving forward and would position California as a leader in organic data collection. Because of limitations in SOP’s current data collection process, we relied on proprietary data that excluded some organic producers to develop these estimates. Recognizing that any improvements to publicly available organic data for California will likely require legislative support and/or additional funding and must balance consideration of reporting burdens and data quality, we outline several ways that SOP could more accurately track organic cropland and animal production. These improvements have been suggested by others in conversations with the authors about robust organic data in California; our study illustrates the urgency of adopting one or more of them, given state agency staff need to bi-annually report on progress towards statewide goals.
Short-term organic tracking
In the short term, the categories used in the SOP registration process, specifically on the Commodity and Acreage Form, could be updated (CDFA 2022). We strongly encourage splitting “All Other Field Crops (Including Pasture/Rangeland)” into two separate categories, one for crop production (all other field crops), and another for animal production (pasture and rangeland). This would allow SOP data to be easily aggregated to measure total crop and animal production separately without reliance on external data or estimation techniques. This would be a powerful improvement to available organic data because the SOP data is likely the most inclusive single source of California organic production data available since it covers all organic producers in the state, even those exempt from federal organic certification requirements (AB-1826 Organic Products 2016).
Long-term, fine-grained organic tracking
We support longer-term improvements to SOP data that would boost data quality by bringing a more nuanced understanding of how organic agriculture is practiced across California. First, SOP could work directly with organic certifiers to gather detailed production data without increasing reporting burdens on farmers. SOP could mirror the federal-level Organic Integrity Database, where certifiers already have mechanisms in place for sharing data on their certified operations (USDA Agricultural Marketing Service 2025) that could be leveraged to make state adoption of this method more streamlined. Uneven administrative impacts on small and large organic operations should be carefully considered when exploring this solution because smaller operations exempt from USDA organic certification will have less access to this streamlined process.
Secondly, SOP could work with the NASS California Field Office to conduct a survey of organics that parallels the Annual Agricultural Production Statistics (CDFA 2024). This option would ensure consistent data collection methods for all California agriculture (including organic and conventional production) and organic California agriculture, yielding highly accurate and adaptable data for exploring organic success across the state. Because organic producers are already included in the Annual Agricultural Production Statistics report, differentiating these producers and compiling a separate report should have limited impact on reporting burdens for farmers.
Acknowledgments
Thank you to Dr. Jahalel Lee Tuil, Kase Wheatley, Dr. Houston Wilson, Krista Marshall, and other members of the California Organic, Agroecological, and Regenerative (COAR) Transitions project team for their collaboration on the larger project of exploring organic transitions across California that this work stems from. That collaboration informed our methodological approach and helped us frame our findings and recommendations. Special thanks to Dr. Houston Wilson and Krista Marshall for helping us understand the organic data landscape in California and its current limitations and improvement options, to CCOF and their staff for sharing anonymized data with us, to Meena Pandey for supporting our literature review efforts, to Dr. Jonathan Wachter for discussing a pre-submission version of our findings in the context of state agency organic reporting needs, to the anonymous reviewers that provided thoughtful feedback for improving this manuscript, and to the editorial team at California Agriculture who facilitated the review and publication process.
This research was funded by the University of California Office of the President via the UC Multicampus Research Programs and Initiatives grant (UCOP MRPI M25PR9207) and by the W. K. Kellogg Foundation.
Counties were removed from analysis when production site acreage data were redacted by SOP.
Because CCOF data may not be representational of organic production overall in Kern County (see technical appendix), we used statewide CCOF category proportions (Equation 1) when calculating Kern County estimates.
Our technical appendix details how we aligned differences between how SOP and NASS count acreages.