California is in the early implementation stages of the Sustainable Groundwater Management Act (SGMA), which requires groundwater basins statewide to eliminate groundwater overdraft by the early 2040s. SGMA also creates a pathway for addressing “undesirable results” driven by overreliance on groundwater, including land subsidence, well failure, declining groundwater levels, and diminishing aquatic ecosystem health (Leahy 2015). While critically important for the security of future water supplies, SGMA will require significant pumping reductions in some basins, constraining water for farming; these challenges are likely to be exacerbated by climate change and new environmental regulations (Escriva-Bou et al. 2023a).
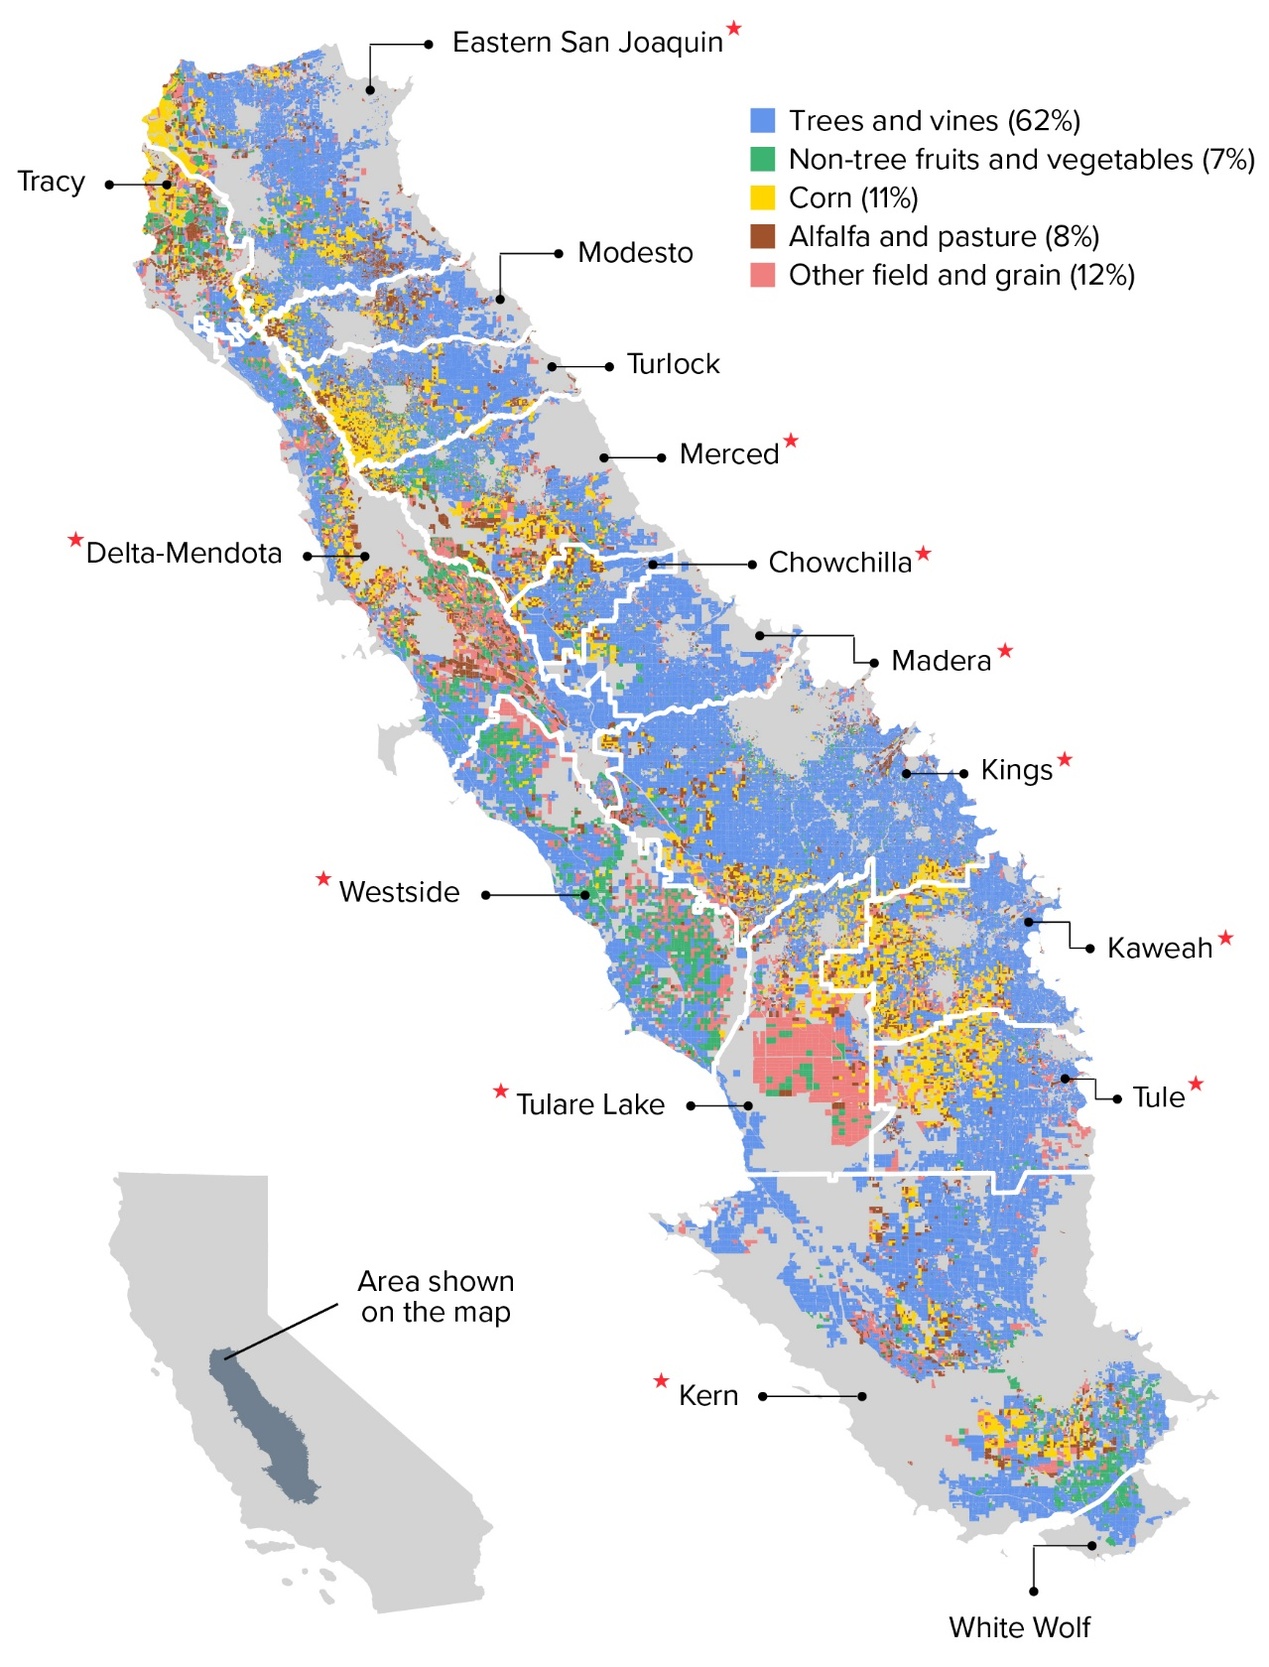
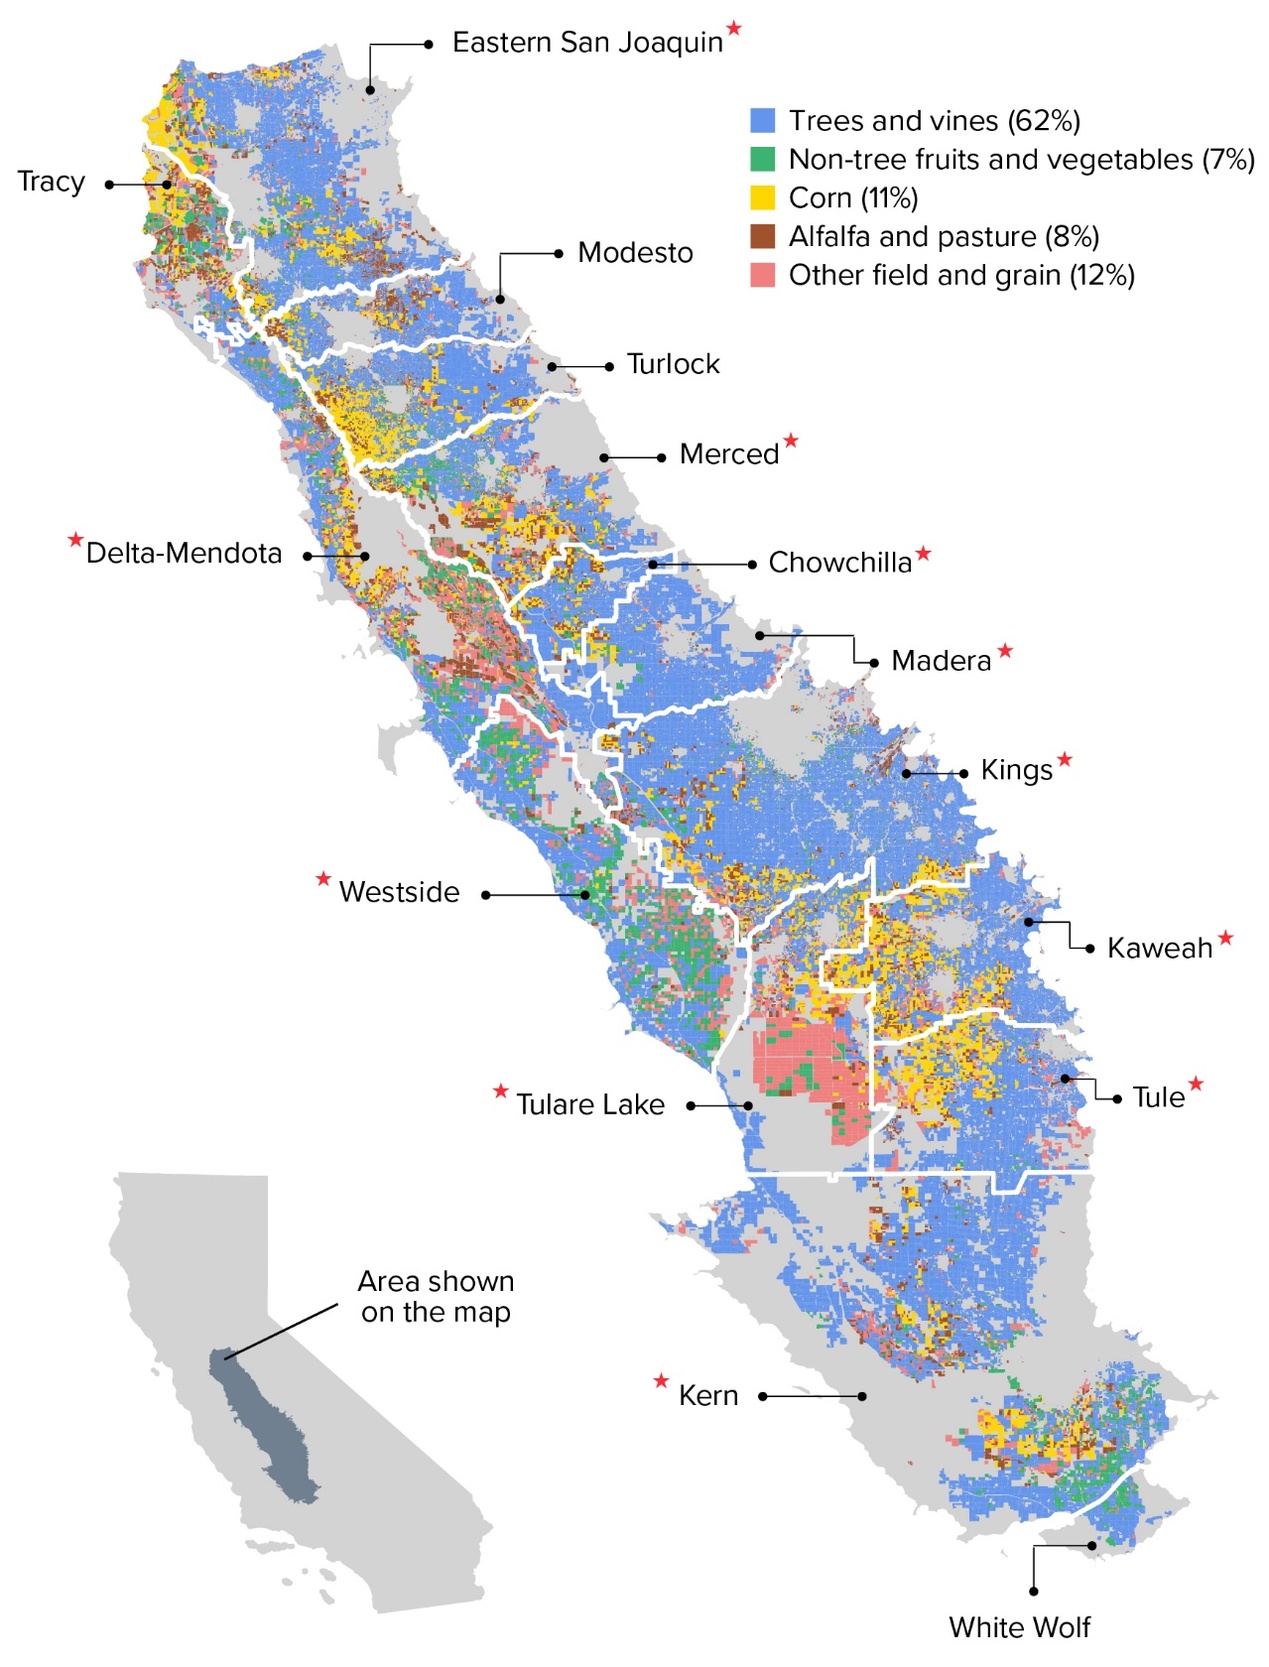
The effects of SGMA will be especially prominent in the San Joaquin Valley, which encompasses over half of the state’s irrigated land (fig. 1) and is known for its production of fruits, nuts, and vegetables. Many consider the San Joaquin Valley to be “ground zero” for groundwater reform, as it includes 11 of the state’s 21 critically overdrafted groundwater basins — those identified to have the greatest groundwater imbalances to address. The region is facing irrigation supply cutbacks of about 20% and short- or long-term fallowing of up to 900,000 acres of irrigated farmland to comply with SGMA (Hanak et al. 2023). Valley residents have expressed significant concerns regarding this land fallowing (Espinoza et al. 2023), including production of harmful dust (Ayres et al. 2022; Adebiyi et al. 2025), uncertainty around future land use (Fernandez-Bou et al. 2025), and losses of agricultural revenue cascading into local tax-base impacts (Hanak et al. 2023).
There is further concern that water cutbacks and fallowing will cause disproportionate impacts for smaller, less-resourced farms and rural communities (CWC 2022, 32–33; Atume and Voss-Gonzalez 2022). These concerns stem in part from limited engagement efforts aimed towards these groups in formal groundwater governance networks (Méndez-Barrientos et al. 2020; Dobbin 2020; Perrone et al. 2023). Smaller farms may also have fewer managerial, financial, or technical resources available to them, which can limit access to water markets and other options to adapt to scarcity (Ayres et al. 2021; Rudnick et al. 2016). The need to anticipate potentially unequal SGMA impacts highlights the gaps in understanding how farm size intersects with characteristics such as access to water and financial viability.
Although prior work has explored farm size distributions in California, few studies examine differences in water availability among farms of different sizes. Macaulay and Butsic (2017) used parcel ownership records from 2005 to 2015 to identify crop type and ownership concentration patterns by farm size across California’s 58 counties. While foundational, this work came early in the SGMA timeline when water use data for local areas was limited. Reade Malagueño et al. (2025) examined questions around farmland ownership and water access yet presented a binary assessment of potential surface water access rather than a quantitative one. And while the U.S. Department of Agriculture (USDA) Census of Agriculture (hereafter “Census”) details sizes of farming operations, its reporting scale — the county — is too coarse to capture localized operating conditions in western states like California, where counties are large and heterogeneous. The Census also reports limited granularity in crop type and may undercount small farms (R. Molinar et al., UC Cooperative Extension Fresno County, unpublished data).
In the decade since SGMA’s passage in 2014, groundwater sustainability agencies (GSAs) have formed and state agencies have supported sustainability efforts, resulting in rich and novel datasets. Improved information on water availability, crop identification, groundwater overdraft, and parcel ownership now warrants a reexamination of farm size in relation to new groundwater regulations. In this study, we leverage newly available data to explore farm size and relationships to water availability in California’s San Joaquin Valley. First, we identify farming operations and their crop compositions and compare this dataset with the 2022 Census to provide new insights on farm size across the valley. We then detail farm sizes as they relate to location, crop choice, availability of water supplies, and economic productivity to draw attention to the relation of these factors to regulations under SGMA. Finally, we investigate how farms of varying sizes may adapt to a less water-rich future and the role that targeted policy could play in supporting smaller farms.
Study design and methods
Identifying farming operations
We conducted a detailed farm inventory using 2021–2022 county assessor records provided by the Lincoln Institute of Land Policy’s Center for Geospatial Solutions, which allowed us to identify nearly all irrigated farm parcels across the valley floor (Ayres et al. 2023). Using county assessor records, we define a farm as all agricultural fields held by the same owner. First, we aligned boundaries for individual parcel records with 2018 irrigated crop mapping data produced by LandIQ (CADWR 2025b) to capture crop acreages and types on each parcel in a relatively normal water year (below normal San Joaquin Valley hydrologic classification index; (CADWR 2026)). We selected LandIQ as the crop mapping product because it has better accuracy in identifying specialty crops grown in California than national products like USDA CropScape (Espinoza et al. 2023). For simplicity, we excluded farm parcels with less than 1 acre of irrigable land, whether cropped or temporarily idle. In many cases, these small parcels are irregularly shaped and may not reflect actively farmed lands.
After assigning crop type to each record, we used computer text-search algorithms to standardize similar owner names. We then manually identified and consolidated owner name entries that we could reasonably determine to be the same individual or holding group. This process included correcting minor differences in fiduciary title abbreviations and standardizing names for farming enterprises known to operate under several names. From these consolidated entries we excluded parcels for which owner names or addresses were missing, totaling about 94,000 cropped acres and 60,000 temporarily idled acres mostly in the Kings, Westside, and Delta-Mendota groundwater basins. We were able to identify and characterize ownership of 97% of the valley’s irrigated cropland, which to our knowledge is the most complete regional farm ownership dataset to date.
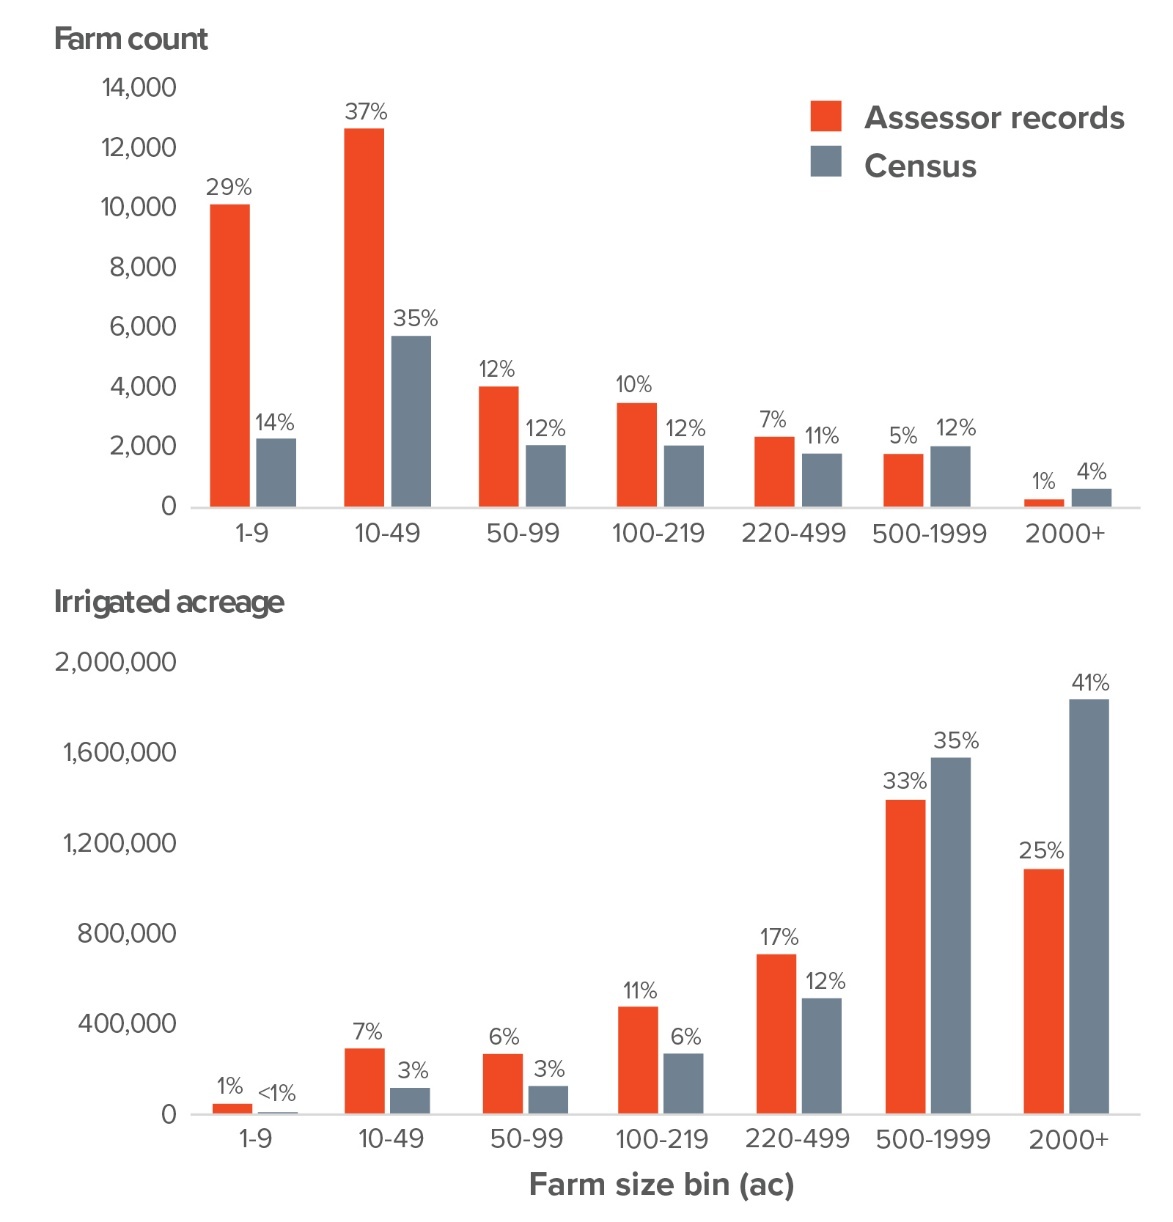
To compare our findings with the Census, we aggregated data from the eight valley counties (Fresno, Kern, Kings, Madera, Merced, San Joaquin, Stanislaus, and Tulare), some of which include small amounts of irrigated land outside the valley floor. The Census reconciles tenancy arrangements differently than our approach: it reports farms that are owned or rented and the type of agreement in place (fully owned, part owned, or rental), while we derive ownership from tax records. While finer numerical size bins (e.g., 1–9 acres, 10–49 acres, etc.) are presented below where they offer additional insight into selected results, we consolidated farms into three size classes to aid comparison with the Census and develop a common terminology: small (1–99 acres), medium (100–499 acres), and large (above 500 acres). It should be noted that other agencies, such as the USDA, may define farm size based on other metrics, such as gross farm income (USDA 2026).
We placed crops into 23 categories with the most prevalent having their own category. For purposes of data visualization, we grouped them into five major crop classes: trees and vines, alfalfa and pasture, field and grain, corn, and non-tree fruits and vegetables (fig. 1). To measure crop diversity, we used Simpson’s Index of Diversity (Simpson 1949)
1−D=1−N∑i=1(nN)2
where N is the total number of crop categories (23) and n is the number of crop categories observed on each farm. We calculated the index values for each of the farms in our dataset using the 23 crop categories, then calculated the acreage-weighted mean index value by farm size class. Simpson’s Index of Diversity measures the likelihood that two randomly selected fields in our sample would not share the same crop category. Values range from 0 to 1, with higher values indicating greater diversity.
Water availability and SGMA impacts
To calculate irrigation demands for farms and at the subregion level, we multiplied crop acreages from LandIQ and crop-specific applied water use estimates adapted from California Department of Water Resources data (CADWR 2025a). We averaged 2011–2013 applied water use estimates for the relevant geographic regions, as this was the most recent available information at the time for representing a balanced hydrologic period and contemporary irrigation efficiencies. For selected crops with less granular data from this source, supplemental information was obtained from OpenET and PRISM (see Escriva-Bou et al. 2023b for more details). We assumed that these demands are met first by historically available surface water supplies and that groundwater pumping comprises the remainder.
Surface water deliveries for individual water districts were estimated from water district reports, groundwater sustainability plans (GSPs), and supplementary reporting from the Department of Water Resources. We used surface water data from 2003–2010, a hydrologically representative period for which consistent data are available throughout the entire valley, building on prior analysis (Jezdimirovic et al. 2020; Ehrens et al. 2021). Using these data, we estimated changes to surface water supplies in each subregion by 2040 due to climate change and environmental flow regulations (see Escriva-Bou et al. 2023b for details). Our approach included water contracted through the State Water Project and Central Valley Project as well as other local sources and imported supplies (i.e., from trading). Surface water deliveries for each water district were standardized to a volume per acre of irrigated land within each service area boundary. We then drew 49 subregion boundaries that encompassed water districts with similar standardized surface water values. These subregions and the average historical surface water availability within each are presented in section SI.1 of the online Supplementary Information.
Baseline groundwater use for each subregion was estimated as the difference between total applied irrigation demands and available surface water. Values were cross-checked with GSP water balances to ensure reasonable agreement. Overdraft estimates were obtained for each basin for 2003–2010 using data from historic water budgets included in their GSPs. To disaggregate overdraft to the subregion level, we assumed that each subregion would be responsible for a share equal to their relative groundwater reliance within the basin, a simplifying assumption that may not fully reflect responsibilities set forth in basin coordination plans. Finally, we estimated future groundwater use for each subregion by subtracting overdraft responsibility from baseline groundwater demand.
Connecting farming operations with water use
From the baseline and future water portfolios developed in the previous section, we calculated average supplies per acre of currently irrigated agriculture available in each subregion (both surface and groundwater supplies). We then used locations to link individual farming operations from the ownership dataset to overlying subregions and assess their water supply availability and vulnerability to groundwater constraints. Note that this approach gives insight into water availability in these local areas, whereas accessibility may vary for individual farms. Many water districts in California utilize priority systems, with priority access given to users with more senior water rights, for deciding which customers receive deliveries first when water is limited. Furthermore, our approach does not reconcile infrastructure constraints that might limit an individual farm’s access to surface water, even if it lies within a district that supplies ample surface water.
Preferential groundwater allocations for smaller farms and communities
Small farms and community water systems (CWSs) are among the “vulnerable users” that the state has identified as needing safeguards in groundwater management, given their limited capacity to adapt to pumping restrictions, participate in SGMA governance, or absorb the costs of obtaining alternative supplies (CWC 2022). Given these concerns, we examined the implications of preferential groundwater allocations for these users. Many GSAs have begun implementing groundwater allocation systems that limit pumping based on the sustainable yield of their basin (Babbitt et al. 2018). These allocations typically ramp down gradually over time, setting pumping limits for individual growers within the agency’s jurisdiction. An alternative approach could create exceptions for modest users, allowing them to pump enough to satisfy their unconstrained demands in lieu of an allocation. However, to remain on track toward the basin’s sustainable yield, these exceptions would generally require the agency to adjust allocations for other users to account for the use of these special groups. While in practice a definition of “modest users” would be decided by the implementing agency, in this paper we chose to define these as domestic users under CWSs and farms irrigating fewer than 50 acres.
To understand the potential impacts of preferential allocations, we estimated water demand quantities for farms under 10 acres, farms 10 to 50 acres, and rural CWSs and compared them with sustainable water supplies under SGMA. For farms, we identified those meeting the criteria from our farm ownership dataset and estimated their demands using the methodology established above by multiplying the acreages in their crop portfolios with crop-specific per-acre demands obtained from Department of Water Resources data. Rural CWSs were identified from data provided by the State Water Resources Control Board (SWRCB 2020), and their water demands were calculated by multiplying the population served in each system by the per-capita domestic water use for the overlying county, obtained from the U.S. Geological Survey (Dieter et al. 2018).
After summarizing water demands for each user group, we calculated sustainable supplies — or the amount of supplies available in 2040 after accounting for cutbacks — in each basin. Then we compared two exploratory scenarios to examine how a preferential allocation scheme may impact water supply distribution for farms (1) if groundwater were allocated preferentially to fully meet these special users’ demands and (2) if both surface and groundwater were distributed equally on a per-acre basis. For both scenarios, we assumed that current cropping patterns and farm size distributions do not change. In scenario 1 we assumed that special users are allowed to pump groundwater to meet all their irrigation demands without restrictions. For scenario 2, we assumed that available supplies are allocated equally across farm size groups in each basin. Under each scenario, we calculated the percentage share of sustainable water supplies that would be allocated to these special user groups.
Estimating farm economics, fallowing, and effects of trading
While farmgate revenues can vary substantially depending on crop variety and marketing practices (including community supported agriculture, farmers markets, etc.), aggregate data can provide broad insights into revenues for farms of different sizes. Crop prices and yields across the eight valley counties for 2017–2019 (inflated to 2019 dollars) were obtained from a combination of USDA National Agricultural Statistics Service surveys and county agricultural commissioner reports and used to estimate per-acre revenues by crop type (see Escriva-Bou et al. 2023b for additional details). We then mapped these values to farms in our ownership dataset with matching crop categories to estimate the returns these farms might expect to earn in a typical year.
We provided some insights on the impacts of land fallowing and how this may relate to farm size by utilizing an agricultural production model to predict shifts in agricultural land use (Escriva-Bou et al. 2023b). The model was calibrated using data on land use, crop prices and yields, production costs, and crop water requirements to reproduce observed baseline cropping patterns given available land and water resources. When water resources are constrained, the model attempts to retain crops with higher net revenues while fallowing less economically productive crops, reducing aggregate economic losses. The model can also simulate varying degrees of water trading, which affects how the model reallocates water to crops. More detailed explanations of model structure, input data, and scenarios are provided in SI.2 through SI.6 of the Supplementary Information.
Results and discussion
Farm identification and comparison with the Census
We identified 34,577 farming operations in the San Joaquin Valley growing 4.37 million acres of irrigated crops (fig. 2). Large farms (above 500 acres) encompass about 2.5 million acres or 58% of acreage. Medium farms (between 100 and 500 acres) account for another 1.2 million acres (28%). Lastly, small farms (under 100 acres) total 0.6 million acres (14%). Despite fair agreement with the Census on acreage (4.55 million acres including idle land), we identified more than twice as many farms as the Census estimate of 16,450. The Census reports higher acreage on large farms and lower acreage across the other size bins as compared to our dataset, likely reflecting that larger farms tend to rent from smaller farm holdings (Bigelow et al. 2016; MacDonald et al. 2018). We found a higher proportion of farms under 10 acres compared to the Census, and a smaller mean farm size of 126 acres compared to a mean of 276 acres in the Census. Although we found a high count of small farms across the valley, they account for about 618,000 acres, a relatively small portion (14%) of irrigated acreage (fig. 2). Detailed farm count and acreage distributions by groundwater basin are provided in section SI.7 of the Supplementary Information.
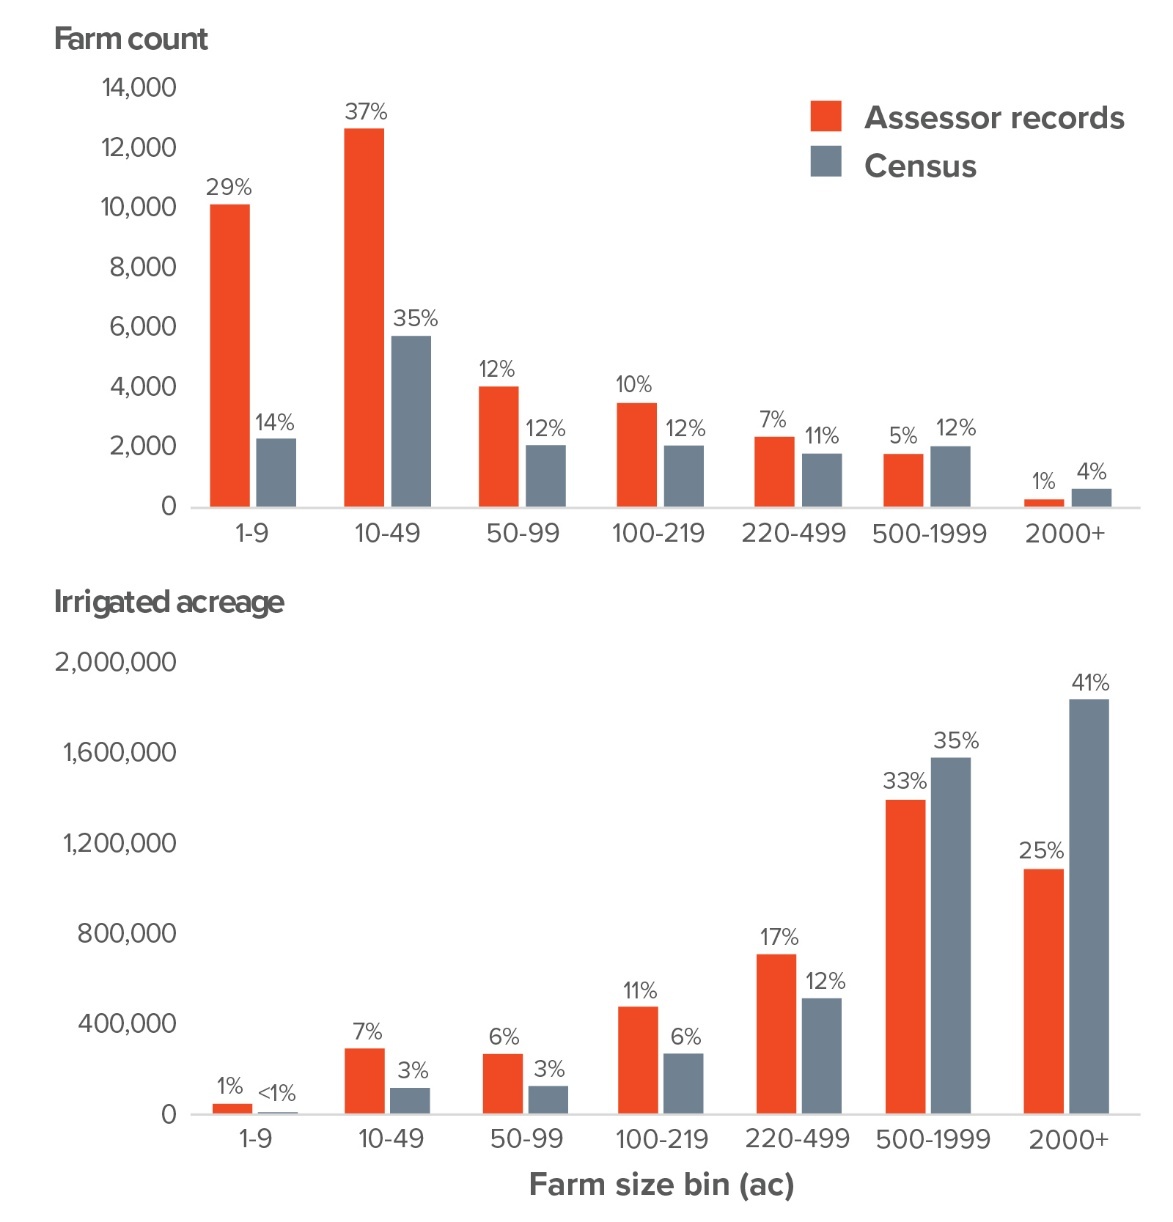
Our analysis showed fair agreement in farm acreage and count with Macaulay and Butsic (2017), who analyzed farm ownership using a similar methodology at the county scale. Using a subset of results for the eight valley counties, they identified 4.60 million acres of cropland across 38,986 farms (mean farm size 118 acres). That fewer farms were identified in our study likely reflects several factors, including farmland consolidation in the years following the Macaulay and Butsic study (Rempel et al. 2024), differences in owner standardization methodologies and cutoffs for inclusion by farm size, and their inclusion of idle land in estimates.
What crops are farms of different sizes growing?
Crop diversity and crop choice can play an important role in adapting to stress under SGMA. More profitable crops, if irrigated as needed, provide more cushion to absorb increases in costs for water or other inputs. Meanwhile, more crop diversity can provide benefits for farm risk management and operational flexibility.
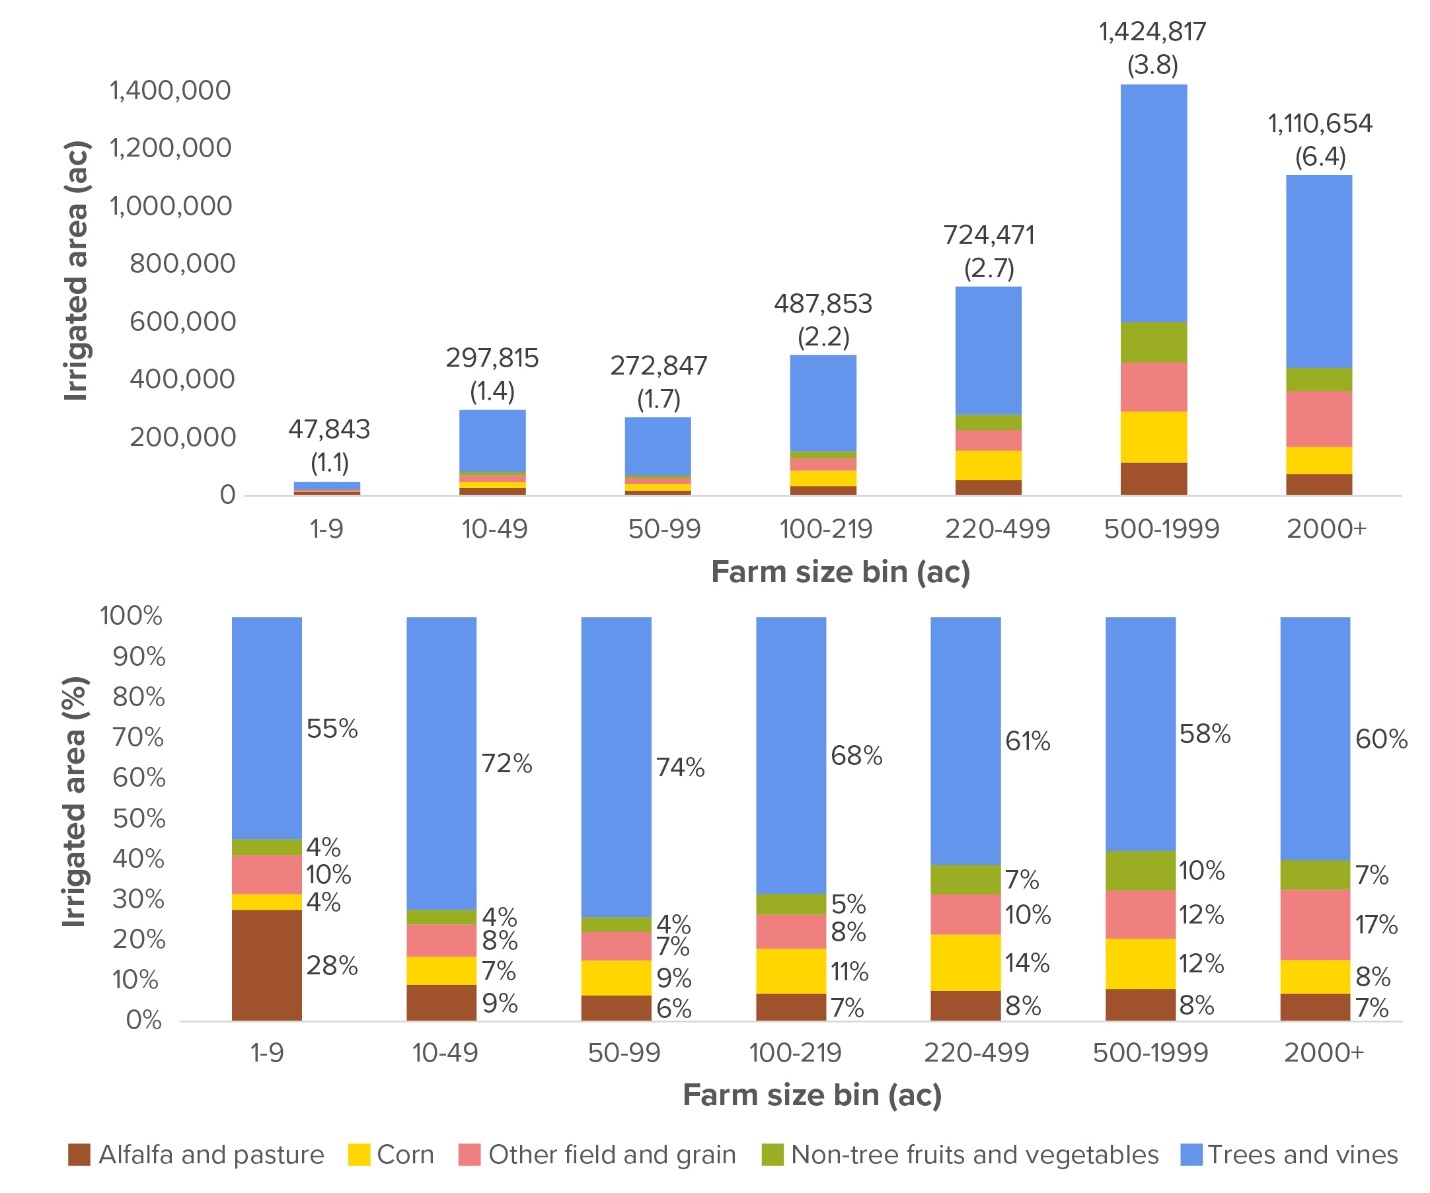
Figure 3 shows the distribution of irrigated crops grown in the valley by farm size, totaling 4.37 million acres (see also Ayres et al. 2023). Over 2.7 million acres (62%) produce tree crops or vineyards. These high-value crops comprise a smaller share of acreage on farms under 10 acres (55%) than on farms between 10 and 220 acres (68%–74%). Almonds are particularly prominent in the valley, comprising about one-quarter or more (24%–28%) of acreage on farms of all sizes, apart from those under 10 acres (16%). Stone fruits (5%–7%), walnuts (7%–8%), and grapes (8%–15%) generally comprise a higher share of farms under 220 acres, while pistachios are prevalent on large farms (13%).
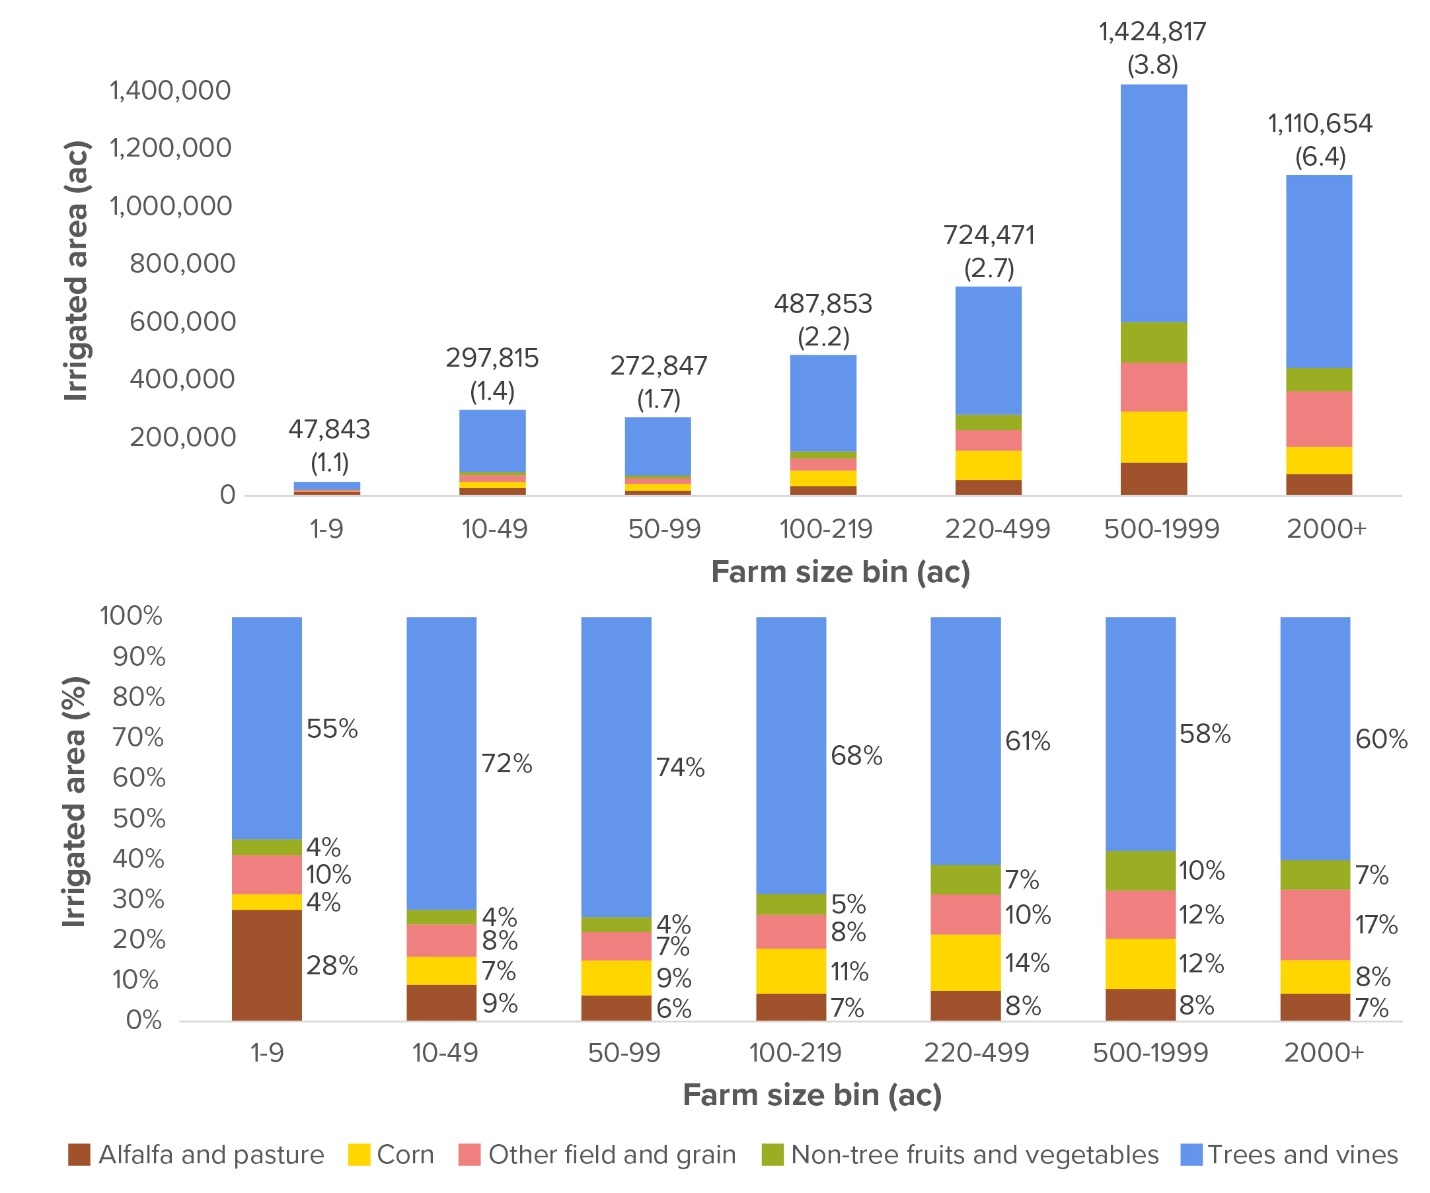
Field and grain crops include cotton and wheat and are found in abundance on large farms (14%). Corn, which primarily supports the dairy industry as silage for feed, is concentrated on medium sized farms (13%). Non-tree fruits and vegetables are more common on large farms (9%), reflecting mass cultivation of vegetables with an industrial market (e.g., tomatoes, carrots, onions, and garlic). Finally, irrigated pasture is especially common on farms under 10 acres in size, composing over a quarter of the acreage of these farms compared to only about 2% of acreage valley wide.
Figure 3 also provides the average number of crop categories grown on farms by size bin, ranging from only 1.1 for farms under 10 acres to 6.4 for farms larger than 2,000 acres. We calculated Simpson’s Index of Diversity values of 0.11, 0.28, and 0.49 for small, medium, and large farms, respectively. This indicates an increasing diversity in unique crop categories present as farm size increases, and aligns with the interpretation that large farms are likely to have multiple business units specializing in specific crops. However, this broad metric fails to capture within-category diversity, particularly on small farms (including Hmong and other Southeast Asian “micro-farms”), which often grow a wide variety of fruit and vegetable crops (Molinar 2012). These crops would likely be placed into the same category in our analysis. We provide further discussion on crop classification for small parcels in SI.8 of the Supplementary Information.
Spatial distribution of farms by size and crop choice
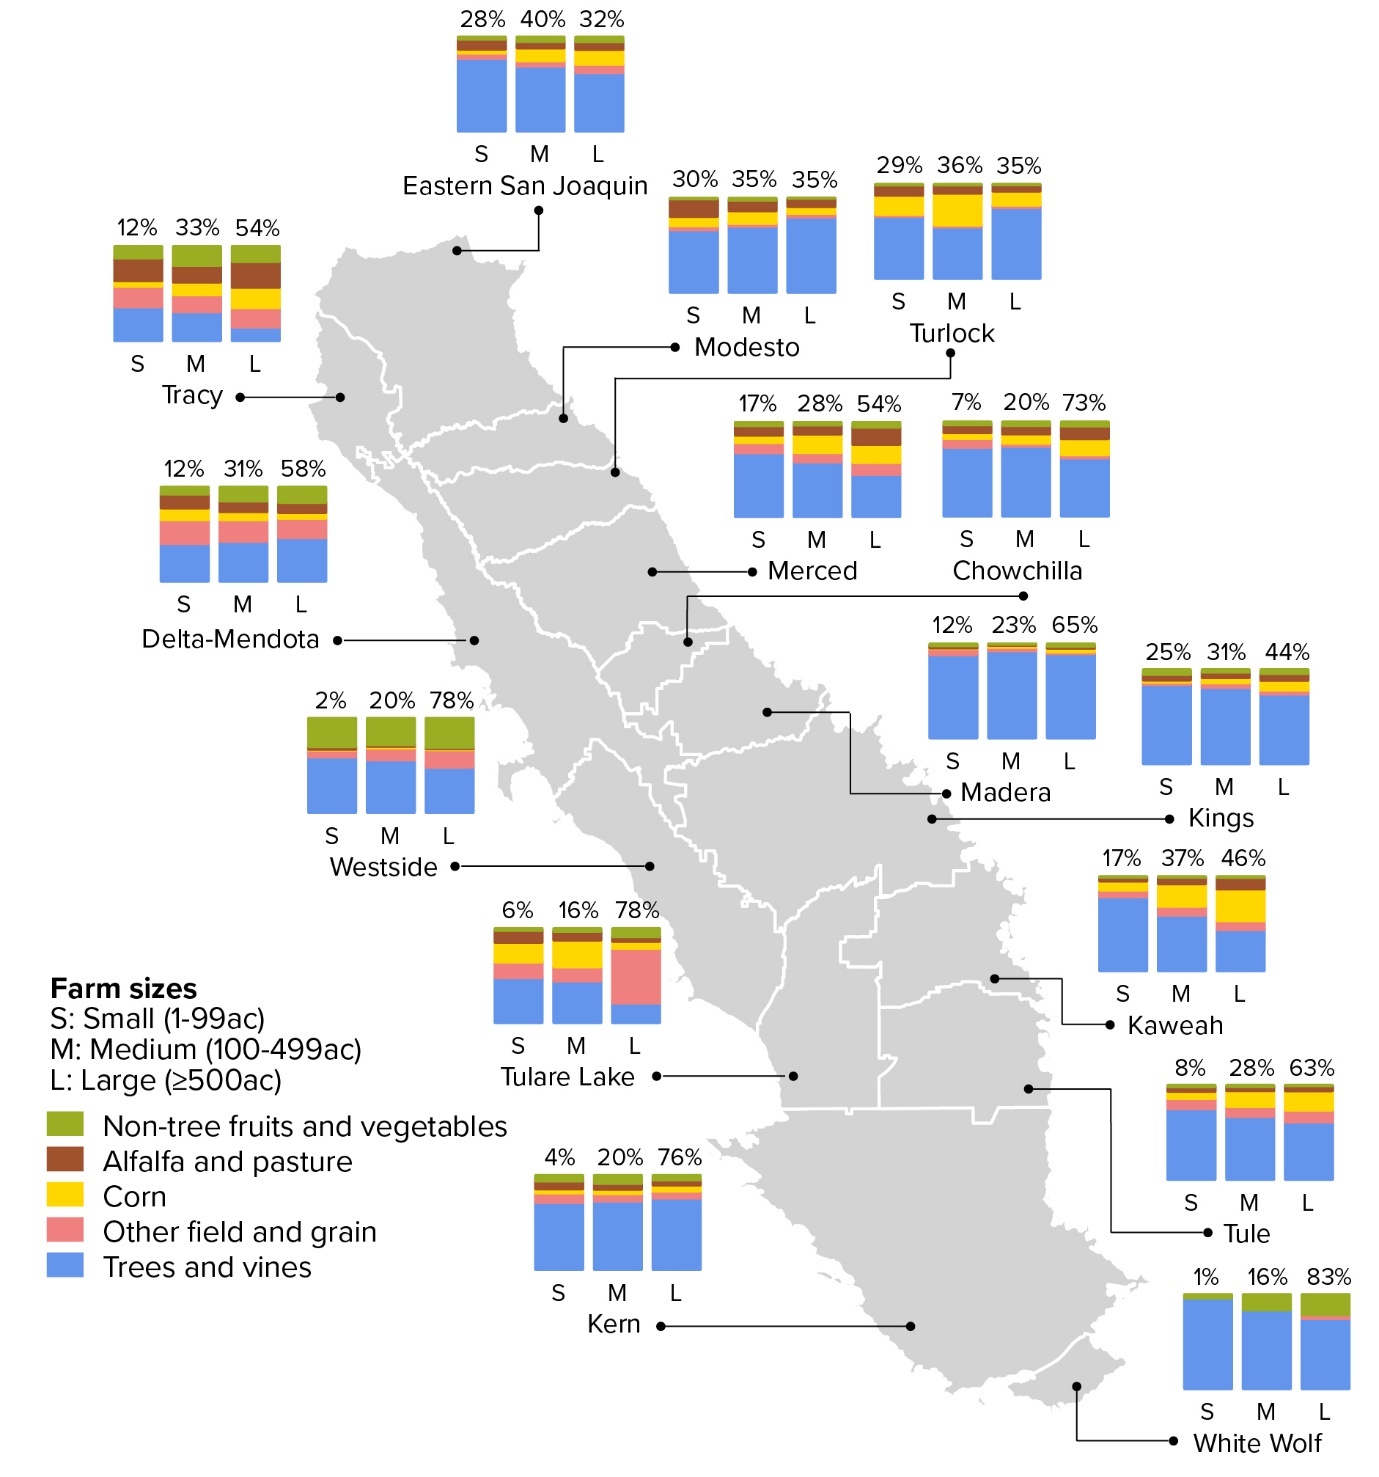
Figure 4 shows the distribution of crops by class and farm size across basins in the valley. Small farms are prominent in several basins, including Eastern San Joaquin, Modesto, Turlock, and Kings, where these farms comprise more than a quarter of irrigated acreage. At least half of the acreage in most basins is attributed to large operations, which are especially common in southwestern basins such as Westside, Tulare Lake, Kern, and White Wolf. Tree crops and vineyards are abundant in many of the eastern basins in the valley, often composing upwards of two-thirds of the acreage in those regions. Annual fruits and vegetables, including tomatoes, are abundant along the western fringes of the valley. Western basins also produce a high volume of field and grain crops; Tulare Lake basin produces about one-quarter of all field and grain crops in the valley (mostly cotton and safflower). Corn is concentrated near dairies in Tulare County (parts of Kaweah, Tule, and Tulare Lake basins) and some northern basins (Eastern San Joaquin, Merced, Turlock, and Tracy), where it is used as a feed crop. Detailed farm count and acreage distributions by groundwater basin are provided in section SI.7 of the Supplementary Information.
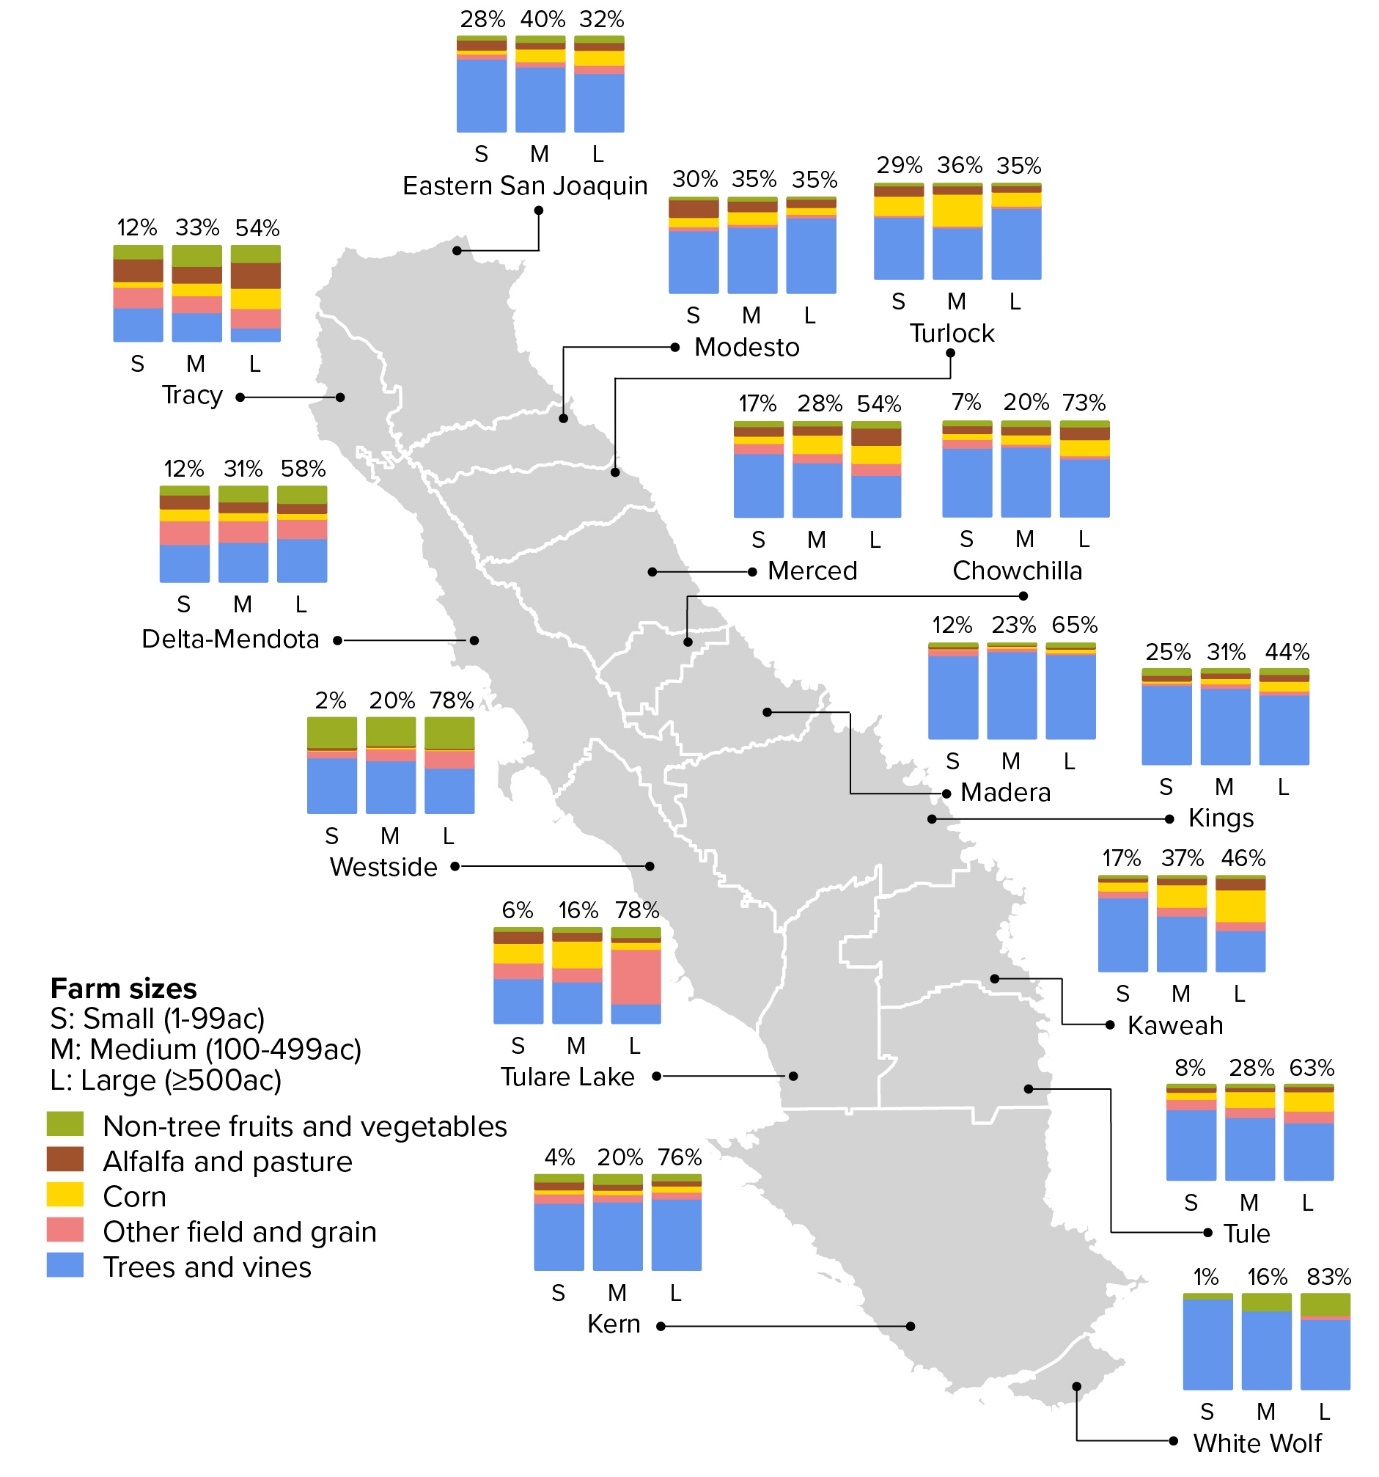
The regional distribution of crops is likely influenced by historical factors such as surface water availability and the establishment date of overlying water districts (Espinoza and Viers 2024). Districts in eastern basins tend to have older, more senior water rights, giving them adequate water access to support high proportions of perennial crops that require uninterrupted irrigation annually. Meanwhile, many western basins depend more heavily on major water projects (the Central Valley Project or State Water Project) whose contracts provide less reliable deliveries and may be better suited for cultivation of annual crops. However, some western basins (such as Delta-Mendota and Tracy) have relatively abundant water supplies, but soil conditions or other local factors influence crop choice (Schoups et al. 2005). While historical water availability has influenced land use, the rapid expansion of high-value perennial crops in recent decades has been motivated less by access to surface water and more by economic factors and the spread of pressurized irrigation systems (Medellin-Azuara et al. 2015; Mall and Herman 2019).
Availability of surface water
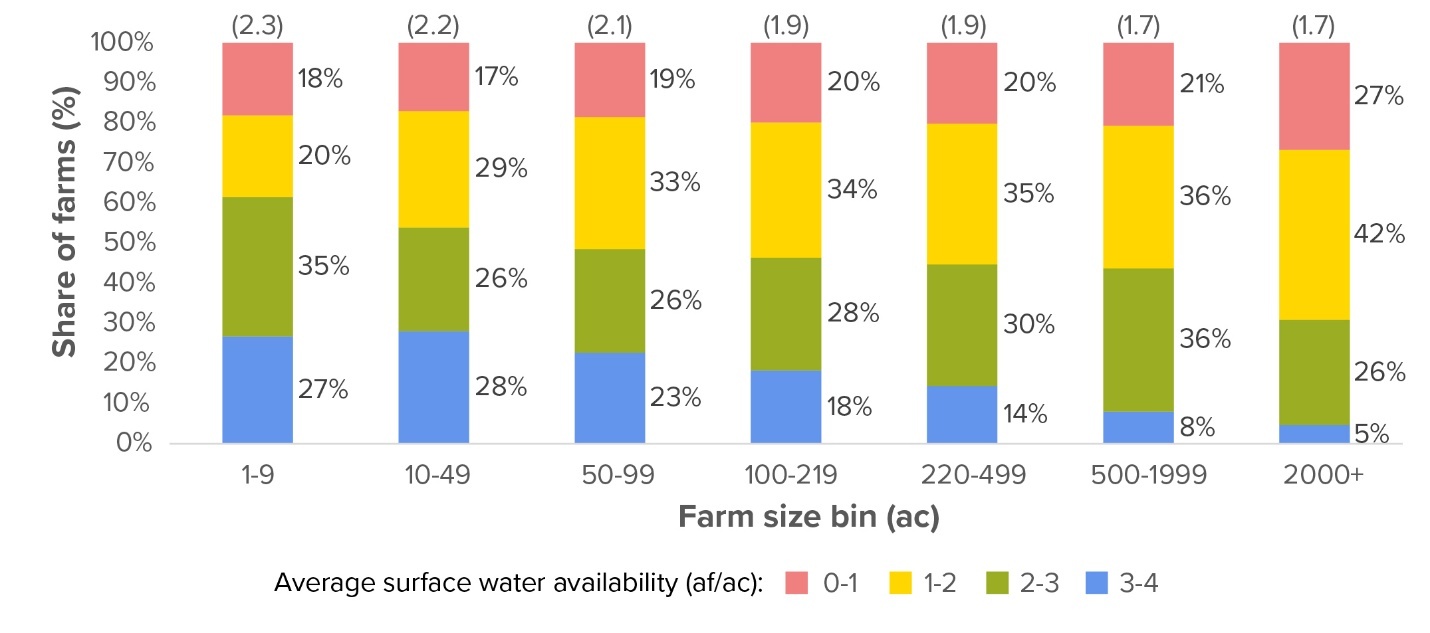
Combining our farm ownership dataset and analysis of historical surface water availability reveals patterns that highlight where vulnerability to water shortages may exist. Depending on location, the average farm in the San Joaquin Valley could expect surface water deliveries of about 1.8 acre-feet per acre of irrigated land (median 2.1 acre-feet per acre and interquartile range [IQR] of 1.5 acre-feet per acre). Yet we found that farm size and local surface water availability are inversely related (fig. 5). On average, farms under 10 acres are located in areas with historical surface water deliveries of about 2.3 acre-feet per acre (about 25% more than the valley wide average) and over one-quarter are in areas where historical deliveries exceed 3.0 acre-feet per acre. Similarly, farms 10 to 49 acres and 50 to 99 acres are located in areas with deliveries averaging 2.2 and 2.1 acre-feet per acre, respectively. In contrast, large farms are located in areas with deliveries of 1.7 acre-feet per acre on average and only a small percentage of these farms would expect deliveries exceeding 3.0 acre-feet per acre.
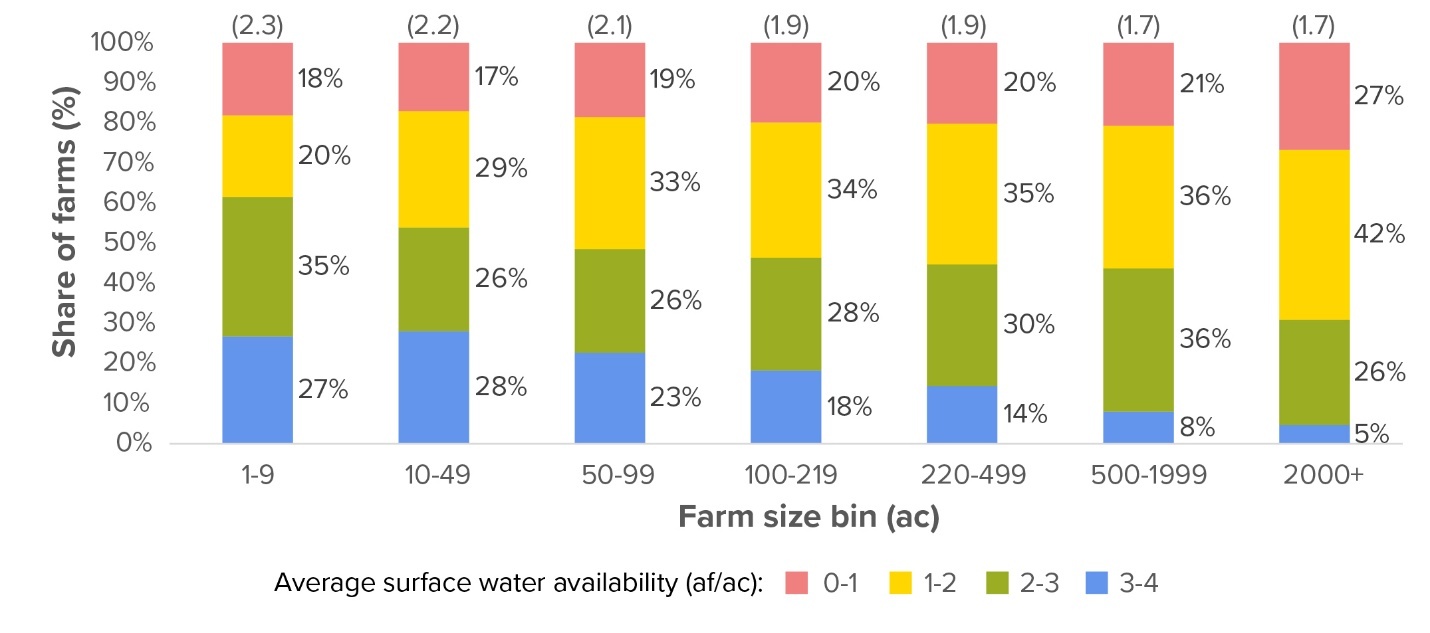
These findings, taken alongside crop water requirements, suggest that smaller farms may rely less on groundwater, which could stem from selection towards areas with better surface water availability where small-scale farming is more economically viable. This lower average reliance on groundwater could be a feature that helps small farms cope with pumping restrictions under SGMA. However, while smaller farms tended to be located in areas with more abundant water supplies, individual farms may not have access to irrigation ditches or canals to receive deliveries even if they have water rights (Rudnick et al. 2016). Other studies have found that while small farms (Eisman and Macaulay 2022) and individual-owned farms (Rempel et al. 2024) tend to drill more wells, these wells are likely shallower and have significantly lower pumping capacity than those supporting larger farms (Reade Malagueño et al. 2025).
Preferential groundwater allocations for vulnerable users
We calculated the water demands of farms under 50 acres and CWSs in the valley to explore the potential impacts of a preferential water allocation scheme. Across the valley, farms under 10 acres encompass about 48,000 irrigated acres and have water demands of about 180,000 acre-feet. Farms between 10 and 49 acres have higher acreage and demand, at about 298,000 acres and 1.09 million acre-feet, respectively. Small CWSs would require an estimated 77,000 acre-feet to support their needs based on State Water Resources Control Board and U.S. Geological Survey data. This total of about 1.35 million acre-feet should be regarded as a conservative estimate of demand for these users given challenges in reconciling farm tenancy and other data gaps.
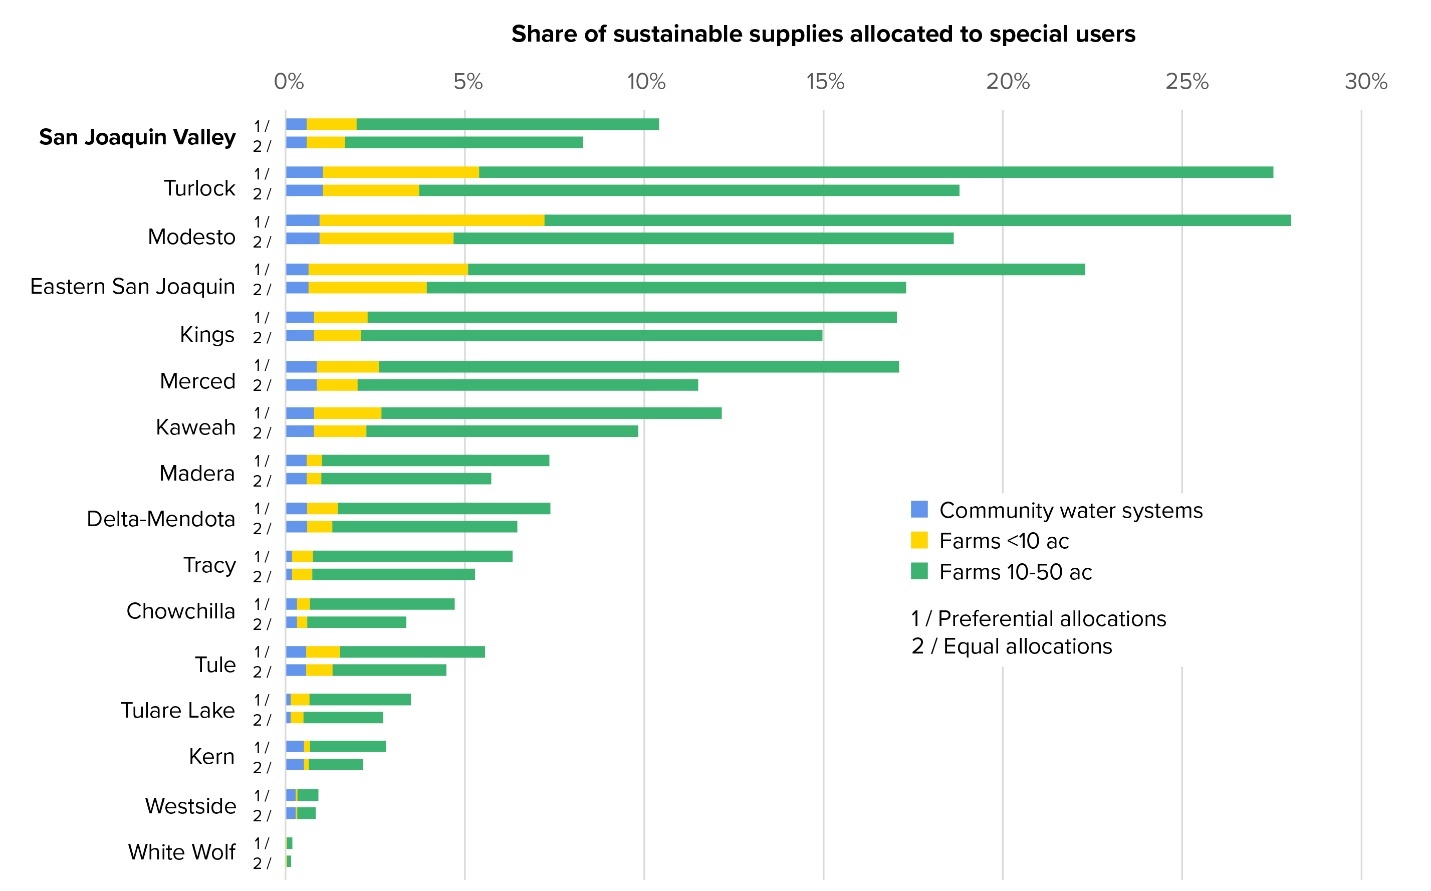
Figure 6 shows the shares of sustainable water supplies in each basin that would support vulnerable users under two scenarios: (1) groundwater is allocated preferentially to meet vulnerable users’ demands, or (2) both surface and groundwater supplies are distributed equally on a per-acre basis. Under scenario 1, about 10.4% of the valley’s sustainable water supplies would be set aside under a preferential allocation scheme to fully meet the demands of CWSs and farms under 50 acres. While full demands for CWSs and farms under 10 acres are small, at about 0.6% and 1.4%, respectively, demands from farms between 10 and 50 acres are more substantial, at about 8.4%. In comparison, assuming equal allocations on a per-acre basis in each basin under scenario 2, these users would have access to about 8.3% of supplies.
_by_groundwater_basin_that.jpeg)
Valley wide, the increase in sustainable water supplies that would be allocated to these users under a preferential allocation system, relative to an equal allocation, would be about 2.1 percentage points. Yet in groundwater basins with a high proportion of smaller farms (e.g., Modesto, Turlock, Eastern San Joaquin, and Kings) this increase would be larger. For example, in the Turlock basin vulnerable user groups would have access to about 27.5% of sustainable supplies under a preferential allocation compared to 18.8% if supplies were allocated equally. Emerging policies in this area should account for these localized impacts, and the tradeoffs they imply, as GSAs consider groundwater allocation schemes.
Farm economics and management
Across the valley we estimated total annual farm revenues of about $24 billion, with average and median farm revenues of about $693,000 per year and $117,000 per year, respectively. Table 1 provides descriptive statistics for revenues by farm size bin. Our estimates do not account for variations in agronomic productivity related to farm practices that could affect yields. Small, medium, and large farms were estimated to produce 16%, 28%, and 56% of total revenues in the region, respectively. Small farms had a slightly outsized contribution to total revenues relative to their acreage — 16% of revenue versus 14% of acreage — while large farms had a lower relative contribution (56% versus 58%). This result could be explained by the specialization in valuable crops on farms between 10 and 100 acres and correspondingly higher per-acre revenues (table 1, last column).
This paper defines farm size by acreage rather than the income-based criteria used by agricultural agencies and programs for administering support services. These differences matter for program design as farm class definitions determine program eligibility. For example, the USDA threshold for “small farms” encompasses those with less than $350,000 in gross cash farm income (USDA 2026). This criterion would exclude many of the farms that are 50 to 99 acres in size (table 1).
Land fallowing and implications for water markets
Accounting for local availability of surface water supplies and overdraft conditions, we estimated land fallowing that may be required to achieve a balanced water budget under SGMA. While some lands would shift to less water-intensive crops, we estimated that about 845,000 acres (19%) of irrigated land would likely come out of production if groundwater overdraft were addressed entirely through demand management (i.e., no new supplies) and without expanding the scope of water markets. Water markets have emerged in the western United States in response to growing scarcity, providing opportunities for short- and long-term water sale agreements between and within sectors to support adaptation (Schwabe et al. 2020; Ayres 2021).
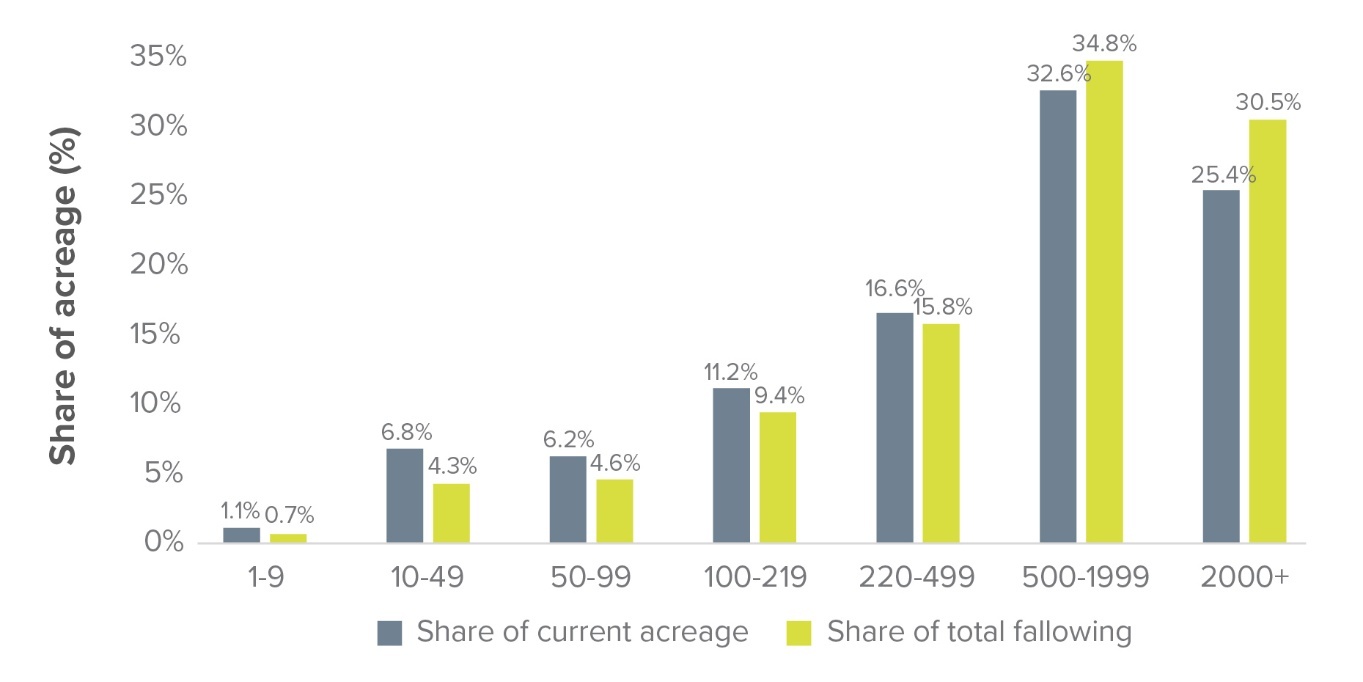
Figure 7 gives the shares of current acreage and land likely to be fallowed in each size bin under this scenario based solely on crop type and average water supply by farm location as estimated by our model. Large farms may bear an outsized share of fallowing (65%) relative to their shares of current acreage (58%), while small farms may experience less fallowing (10% share of fallowing compared to 14% share of current acreage).
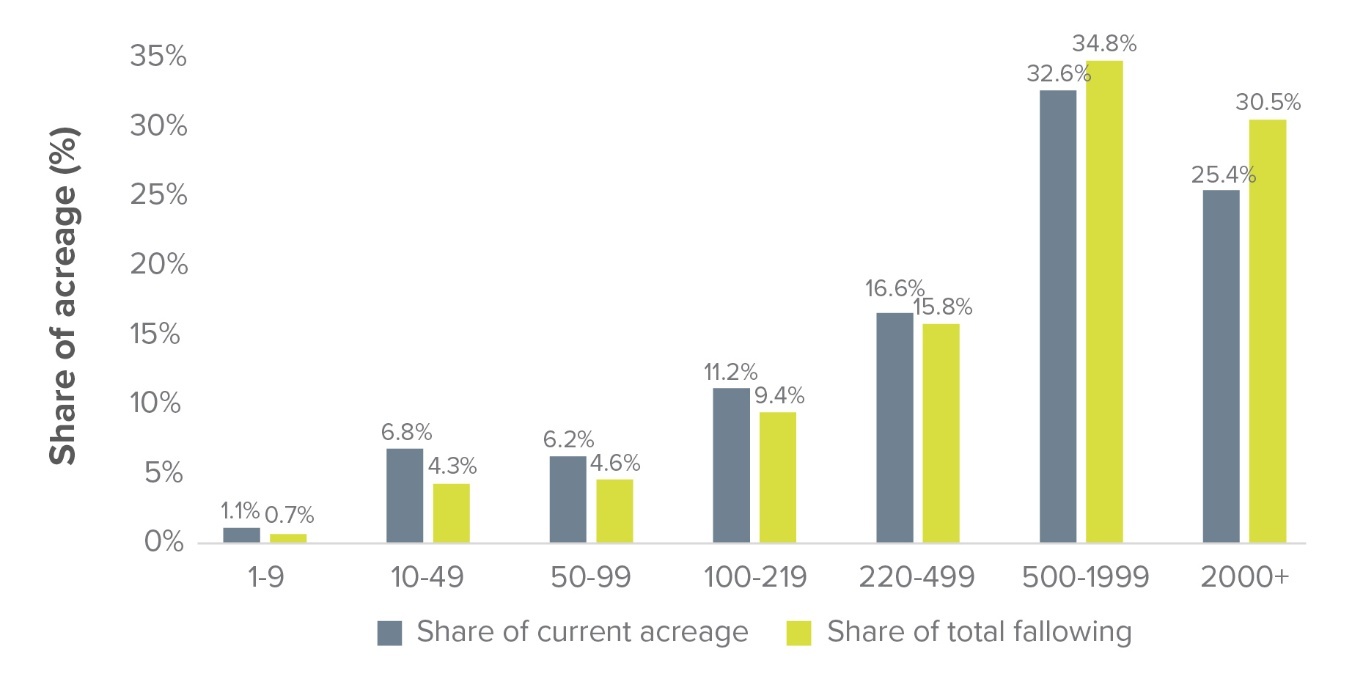
More flexible water markets would likely shift water from lower-value crops such as grains, hay, and irrigated pasture to those with higher earning potential like fruit and nut trees. Given crop choice dynamics and local availability of water supplies (figs. 3 and 5), markets could have implications for the intersection between farm size and land fallowing (Cole et al. 2023; Hanak et al. 2023). Farms with a high prevalence of lower-value crops — for example, farms 1 to 9 acres where irrigated pasture is abundant or those larger than 2,000 acres with significant acreage in field and grain crops — could expect to see more fallowing. However, even under better-developed water markets, high transaction costs would likely disproportionately affect smaller farmers, making them less likely to participate as buyers or sellers.
Conclusions and directions for future work
The varying impact of agricultural and water policies on farms of different sizes has long been politically salient and of interest in policy and management research. However, clear understanding of these processes has been hindered by a lack of data documenting farm sizes at local and regional scales. The USDA Census of Agriculture is foundational but provides a relatively coarse overview of farm size distributions; recent research has made strides in characterizing farm size at finer scales in California. We build upon this work by leveraging recently available data to develop updated farm size distributions for California’s San Joaquin Valley, which we link to relevant farm characteristics, including novel consideration of local surface water availability.
This research helps to characterize the important place that farms of varying sizes occupy in the agricultural landscape of the San Joaquin Valley. Through this work we highlight several potential assets for small farm adaptation to SGMA, including being located in areas with more robust surface water availability and cultivating a greater proportion of high-value crop types. Additionally, we examine economic productivity on farms of varying sizes and provide insight into how farm characteristics may influence land fallowing patterns under SGMA. Lastly, we demonstrate the implications that a preferential allocation scheme for smaller farms and community water systems could have for sustainable water supplies by groundwater basin. Nonetheless, concerns about the readiness of small farms to adapt and their incorporation into GSA- and basin-level planning processes persist. Expanded engagement from GSAs and state agencies — especially on prominent issues such as protections for shallow groundwater wells and developing water markets — will be crucial to ensure that farms of all sizes are placed on an even playing field.
Acknowledgments
We would like to thank Jeff Allenby and Hallah Elbeleidy from the Lincoln Institute of Land Policy’s Center for Geospatial Solutions, who worked with us to create a dataset on agricultural parcels. This work was supported by the Lincoln Institute of Land Policy and the USDA Secure Water Future grant at UC Merced (AFRI Grant no. 2021-69012-35916).